- ES technicals remain bullish as prices approach all-time highs.
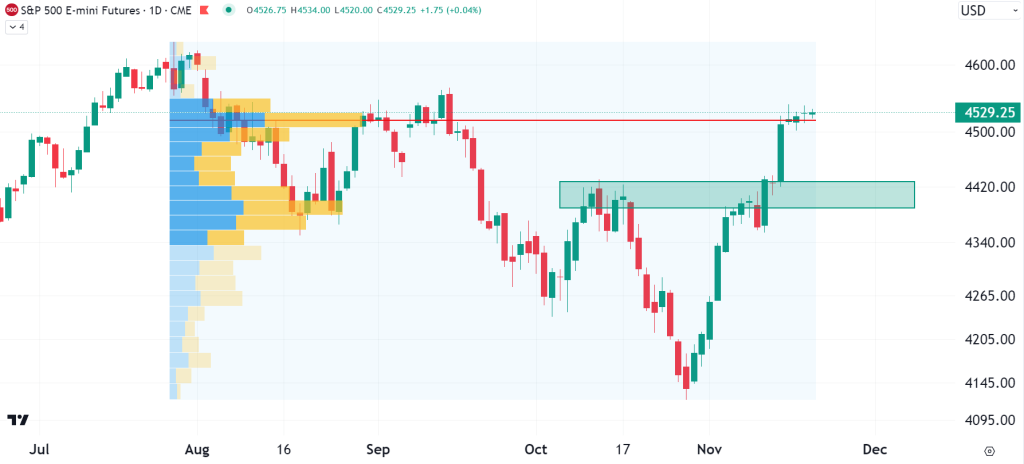
- The daily chart volume profile shows price is currently sitting on the point of control line.
Introduction
The S&P 500 Futures (ES) exhibit strong bullish signals both on the technical side and on the fundamental side. Price is hovering around $4531, with last week closing up 2.1%. ES is only 6.2% away from all-time highs now, and the question is whether we see new highs before the year’s end?
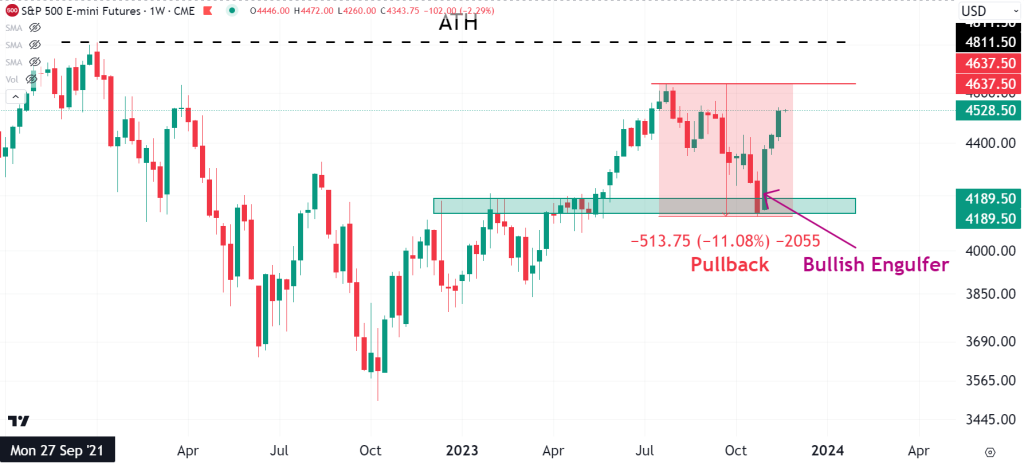
Weekly Chart
After an 11% pullback (marked on the chart) price found some support at the 4189.50 zone and bounced out with a powerful bullish engulfer. From there, we saw two more green weeks as US economic data pointed toward the Fed not raising rates in December. This was the catalyst that sent the market skyward.
Daily Chart
If we had to make a prediction on whether this week would cost red or green, it would be a difficult one to make. It is likely we see some sort of retracement at the beginning of the week, possibly toward $4420. We should also note that if we draw a volume profile indicator from the July peak, price is currently testing the point of control line. This represents the price level where most trading volume has taken place and usually acts as strong support or resistance. This is the main reason why, if we are bullish, we wait for a small pullback before taking a long position.
Conclusion
There are a lot of geopolitical tensions that we must all be watching closely. Markets are ignoring the threat from the Middle East conflict, and a significant development there could spread fear rapidly in the market. With that said US equities seem determined to break all-time highs soon, so we can still take long positions but with strict money management rules and stops in place. The technicals are bullish, so we can still go with the trend and profit from that.