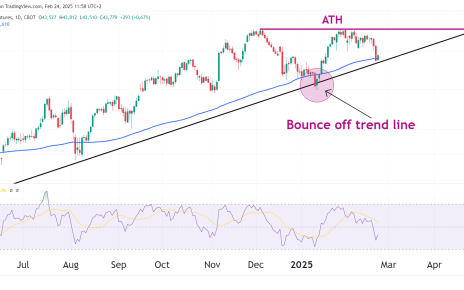
Introduction E-mini Dow Jones futures (YM) have rebounded off trendline support, regaining strength after a recent pullback. Price tested the ascending trendline and the 100-day VWMA (43,610), holding above these levels and keeping the long-term uptrend intact. Market Drivers & Key News Events Technical Analysis Bounce from Trendline—Higher Lows Intact Key Support & Resistance Levels Read More…
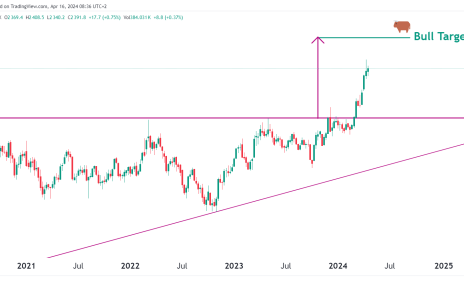
Weekly Chart: The price action is hovering above an established multi-year support zone that is the main point for the bull’s case. The Alligator indicator shows the Jaw, Teeth, and Lips converging, signaling a potential consolidation phase. However, with the price maintaining levels above the Alligator’s Lips, we maintain a bullish outlook. The RSI is Read More…
Gold Prices Steady Amid US Dollar Strength and Geopolitical Tensions The gold price continues to rally above all-time highs as bulls take firm control. The gold strength comes despite a strong Dollar but what is driving this price action? On one side, Asian markets have been declining, influenced by the possibility that the FED is Read More…


