


Introduction
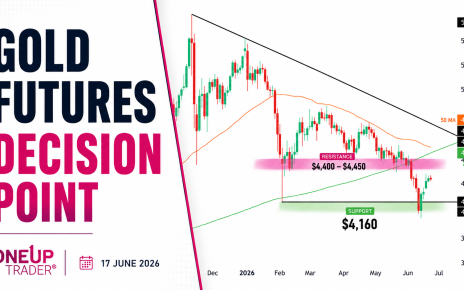
Nasdaq 100 E-mini futures (NQ) are currently trading at 21,464, down 0.95% for the session, as price action consolidates within a symmetrical triangle formation.
With the 50-day SMA (21,483.66) acting as short-term support and the 200-day SMA (20,040.68) providing long-term support, Nasdaq futures are coiling within a tightening range. Lets see what the technicals tell us.

Technical analysis overview
Symmetrical triangle consolidation
- Price is forming a symmetrical triangle.
- The upper boundary near 21,619 is first point of resistance, while the lower boundary at 21,230 is short-term support.
- A breakout above 21,619 could fuel a rally toward 22,223 (R1 pivot level) or higher, while a break below 21,230 could open the door for a retest of 20,700.
Support and resistance levels
Resistance levels (Upside Targets)
- 21,619 (Triangle Resistance) – A breakout above this level would indicate bullish continuation.
- 22,223 (R1 Pivot Level) – First upside target post-breakout.
- 22,451 – 23,000 (All-Time High Zone) – If bullish momentum strengthens, price could target new highs.
Support levels (Downside Targets)
- 21,230 (Triangle Support) – Key level where buyers have previously stepped in. A break below this would indicate bearish momentum.
- 20,700 – Major short-term downside target.
- 20,040 (200-day SMA) – Critical long-term support level.
Scenarios to watch
Bullish Case: Breakout above 21,619 (Higher probability – 60%)
- If Nasdaq breaks out above 21,619, buyers could push the index toward 22,223 and possibly 22,451 (ATH).
- Holding above the 50-day SMA strengthens the bullish case.
Bearish Case: Breakdown Below 21,230 (Lower Probability – 40%)
- If price falls below 21,230, selling pressure could accelerate toward 20,700 and even 20,040 (200-day SMA).
- A breakdown would signal trend weakness and potential deeper correction.
Trade setups
Bullish setup (Breakout Trade)
- Entry: Long on breakout above 21,619, targeting 22,223 – 22,451.
- Stop-Loss: Below 21,400 to manage risk.
Bearish Setup (Breakdown Trade)
- Entry: Short on breakdown below 21,230, targeting 20,700 – 20,040.
- Stop-Loss: Above 21,500 to minimize losses.