Introduction
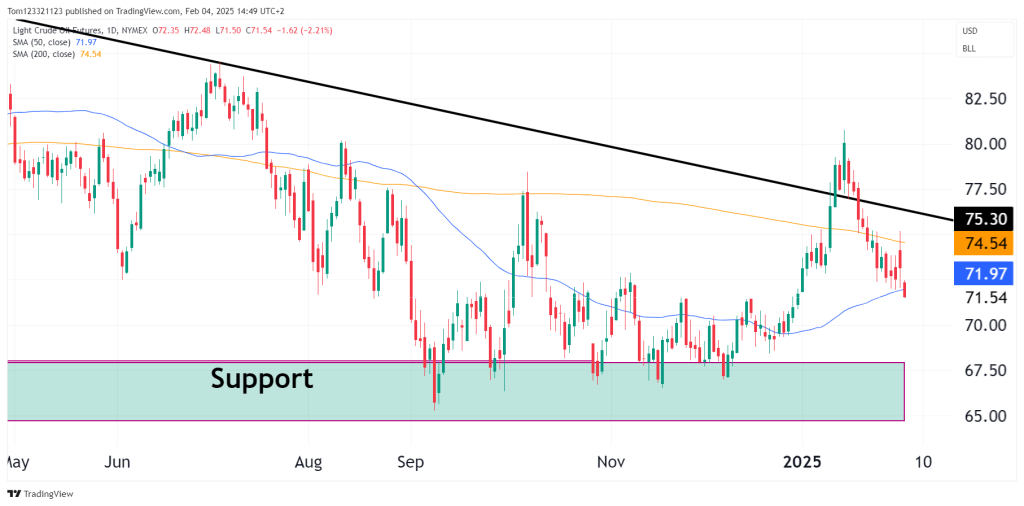
In our January 24, 2025 analysis, we highlighted crude oil’s rally into resistance at the 200-day SMA (74.54) and the descending trendline. We noted that failure to break above these levels would likely result in a pullback, with support levels around 71.97 (50-day SMA) and the broader $67.00 – $68.50 support zone coming into play.
Since then, price action has played out bearishly, with crude failing at 75.30 resistance and now dropping 2.21% to $71.54, testing the 50-day SMA as expected. The short-term outlook remains bearish, with the next test being whether bulls can defend support or if further downside is ahead.
Technical analysis overview
Trendline rejection & breakdown below 200-day SMA
- Crude oil failed to break the descending trendline, reinforcing the long-term downtrend structure.
- Price also lost the 200-day SMA (74.54) after a brief attempt to reclaim it, confirming a rejection at resistance.
- The breakdown signals further downside toward support levels.
50-day SMA retest at 71.97
- Price is now testing the 50-day SMA (71.97), a level that previously was support.
- If buyers step in, a relief bounce could occur, but failure to hold this level could accelerate selling pressure toward the support at 67.50.
Support and resistance levels
Resistance levels (Upside Targets)
- 74.54 (200-day SMA) – The first major resistance; price must reclaim this level for any bullish reversal.
- 75.30 (Trendline Resistance) – The key level where price was rejected; breaking above it would indicate a structural shift.
- 77.00 – 78.00 – A breakout target if oil regains bullish momentum.
Support levels (Downside Targets)
- 71.97 (50-day SMA) – Immediate support; a breakdown could trigger further losses.
- 67.00 – 68.50 (Major Support Zone) – A significant area where price previously found strong demand.
- 65.00 (Extended Downside Target) – If selling intensifies, this could be the next key level.
Momentum and trend analysis
Moving averages
- 50-day SMA (71.97) is the short-term support level; a breakdown here could shift momentum further bearish.
- 200-day SMA (74.54) remains the key long-term resistance level.
Trend and momentum
- Oil remains in a long-term downtrend until it breaks above the descending trendline.
- The recent rejection suggests bearish continuation unless buyers defend the current support zone.
Scenarios to watch
Bearish Case (Higher Probability – 65%)
- If price breaks below 71.97, selling pressure could push oil toward $68.50 – $67.00 support.
- A confirmed move below 67.00 would shift the outlook to a deeper correction.
Bullish Case (Lower Probability – 35%)
- If the 50-day SMA holds, crude could attempt a bounce back toward 74.54 resistance.
- A breakout above 75.30 trendline resistance would confirm a reversal toward 77.00 – 78.00.
Trade setups
Bearish Setup (Higher Probability Trade)
- Entry: Short on a breakdown below 71.97, targeting 68.50 – 67.00.
- Stop-Loss: Above 73.00 to minimize risk.
Bullish Setup (Reversal Trade, Lower Probability)
- Entry: Long if price holds 71.97 and bounces, targeting 74.54 – 75.30.Stop-Loss:
- Below 71.50 to limit downside.