Introduction
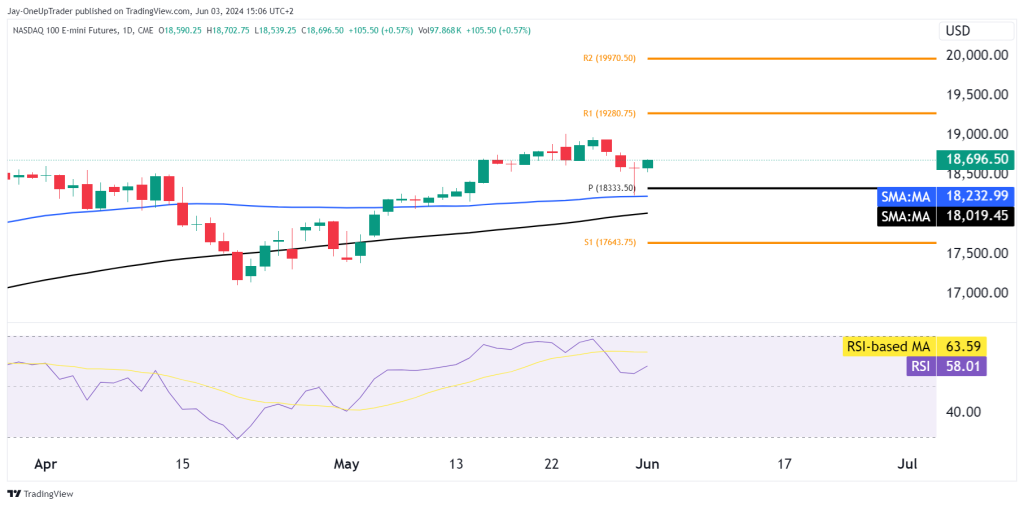
The Nasdaq e-mini futures (NQ) painted a huge bullish candle from last Friday in the form of a doji that is busy confirming a morning star pattern. The price has already pushed above last Friday’s high, confirming the bullish price action. The doji from Friday also bounced right off the 100 MA. This could be the signal to take longs for the medium term so lets look at some trade opportunities.
Analysis:
Price Action:
- The price is currently trading above both the 50-day (blue line) and 100-day (black line) moving averages.
- The price bounced off the 100 SMA and the pivot point showing big bullish strength.
Support and Resistance Levels:
- Resistance Levels:
- R1 at 19,280.75
- R2 at 19,970.50
- Support Levels:
- S1 at 17,643.75 if the morning star fails (unlikely right now).
- Moving averages at 18,233.00 (SMA:MA) and 18,019.45 (SMA:MA)
Relative Strength Index (RSI):
- The RSI is currently at 58.02, which is neutral but leaning towards the bullish side as it is above 50.
High-Probability Trade Opportunities:
Long Trade Opportunity:
- Entry: Buying now citing the morning star candlestick formation.
- Stop Loss: Below the morning, start low ($18,200)
- Target:
- First target at R1 (19,280.75)
- Second target at R2 (19,970.50)
- Probability: High
Conclusion
The trend is bullish, and the recent pullback has provided a solid entry. As long as the price remains above $18,200, the bulls are in control. Remember to keep strict money management rules in place and don’t risk more than you can afford to lose.