

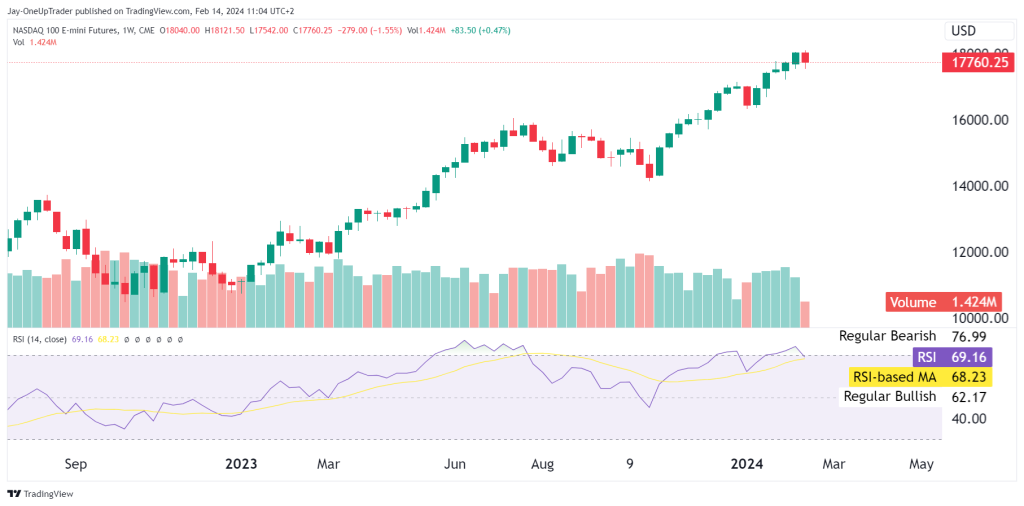
Weekly Chart
The weekly chart shows a strong uptrend with the Relative Strength Index (RSI) reading above 60, this is still strong bullish momentum. The volume on the weekly has been consistent as the trend continues to make higher highs. For traders looking to join the uptrend, a pullback toward the RSI-based Moving Average (MA) around 68.23 could offer a potential entry point. However, we must be cautious of the RSI approaching overbought levels, which could signal a possible retracement or consolidation in the near term.
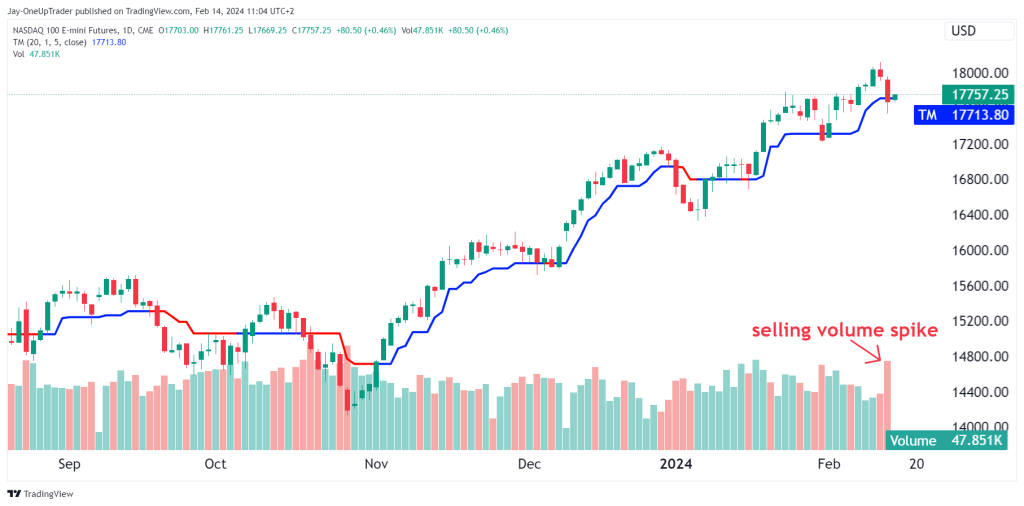
Daily Chart
Moving to the daily chart reveals a continued bullish trend with the recent price action trading above the Trend Magic (TM) indicator, which acts as a dynamic support. The selling volume spike noted on the chart happened after rate cuts expectations were drastically reduced. We could consider this a buying opportunity as long as the price remains above the TM at 17713.80.
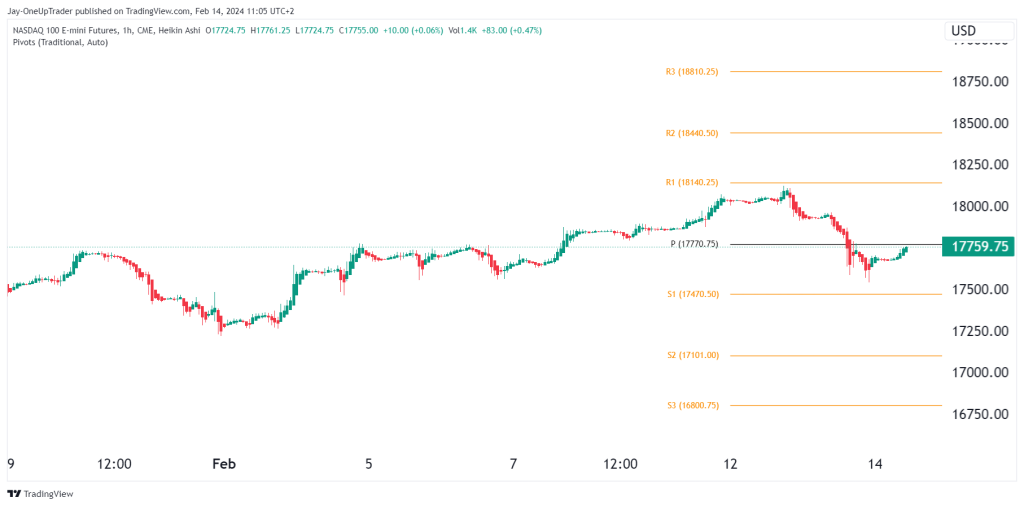
Hourly Chart
We see the price hovering around the pivot (P) level at 17770.75. A break above the first resistance (R1) at 18140.25 could open up the path towards the second (R2) and third (R3) resistance levels. If the price breaks below the pivot, support levels at S1 (17470.50), S2 (17101.00), and S3 (16800.75) will be crucial to watch.
Trades
For trades, based on the weekly and daily charts, long positions could be favored, using the TM and pivot levels as dynamic support. If entering long, place a stop below S1 to manage risk. If you’re looking for short opportunities, a break below S1 with high volume could signal a shift in trend, and targeting S2 and S3 may be good, with a stop above the pivot point to limit potential losses.

