

4 min reading time
Introduction
Gold futures have fallen back into the summer support zone, putting $4,000 in focus. The main fundamental reasons for the decline are rising US bond yields, expectations of tighter monetary policy, and a stronger dollar.
In our October 2 analysis, we highlighted the risk of another test of the summer base if buyers could not establish a recovery. That test has now arrived, with gold still below both moving averages and the daily trend favoring sellers.
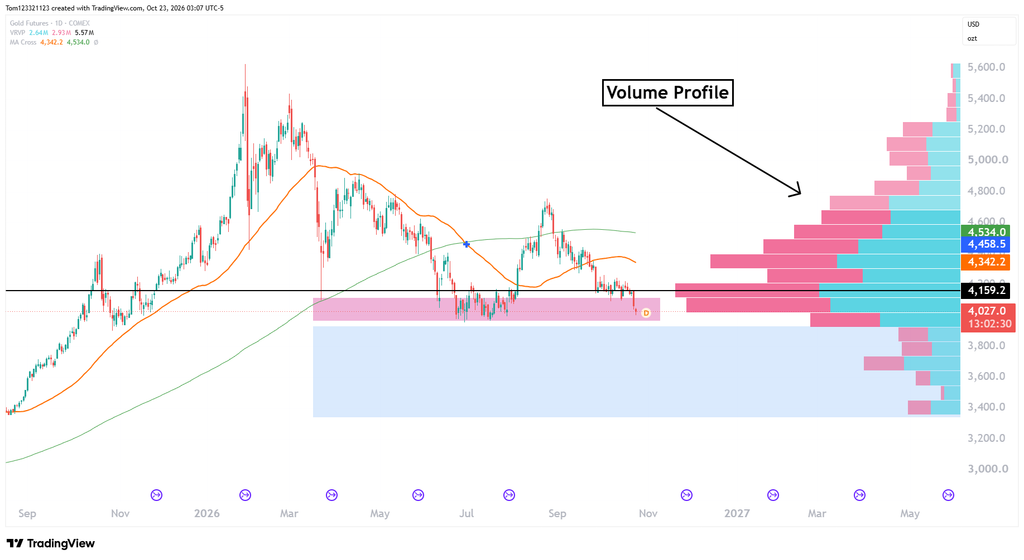
This is an important area for a potential bounce, but the bulls have not shown their strength yet, and they need to, because the volume profile indicator is showing something that the bulls should be concerned with.
Daily Chart
The recovery from the June–July lows carried gold toward $4,700–$4,750 in August. Since then, the market has formed lower highs and surrendered most of that rally.
During October, price briefly settled around $4,150–$4,250. The latest selloff has broken that range and pushed gold into the support zone we highlighted on the chart.
Looking above at the daily chart with volume profile, there is a big low-volume node just below the support zone. When price breaks through a support or resistance level into a low-volume node, the volatility spikes because there is less liquidity at those levels, so we see an accelerated price move. This means that we could see gold drop to $3,500 very quickly.
Is $4,000 a Buying Opportunity?
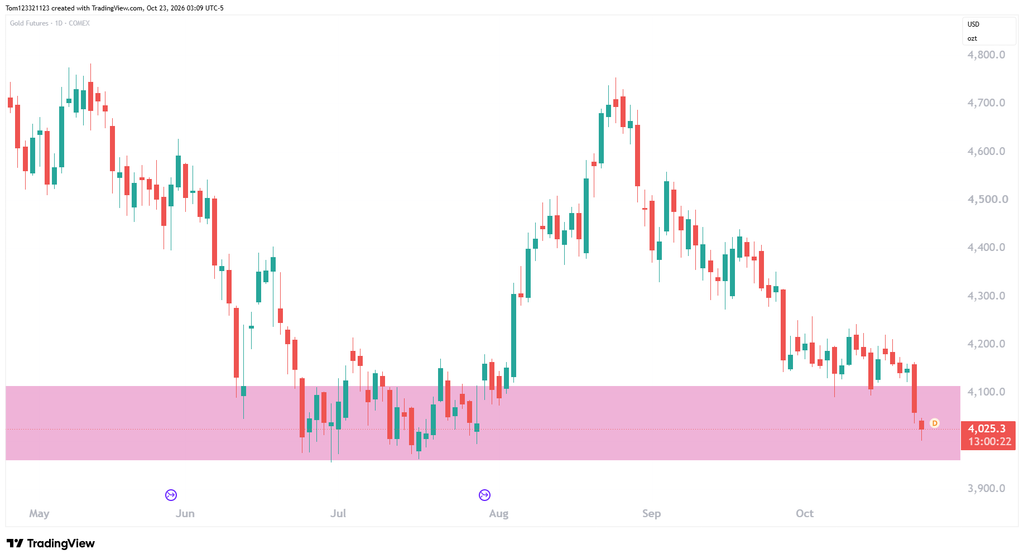
Buyers would want to see the decline slow, followed by a recovery above the upper edge of the support zone near $4,110. Holding that level on a pullback would strengthen the case for a move back toward $4,150–$4,250.
Possible Trades
Bullish rebound: A recovery above $4,110, followed by a successful retest, would support a bounce toward $4,150 and then $4,200–$4,250. The stop would go below the swing low supporting the entry. Because the first resistance is nearby, the entry needs enough room to justify that risk.
Bearish continuation: A daily close beneath approximately $3,960, followed by a failed retest from below, would strengthen the breakdown case. $3,900 and $3,800 would become the next downside reference levels. Selling directly into the current support zone carries the risk of a sharp rebound.
This analysis is for educational and informational purposes only and does not constitute trading advice or a recommendation to buy or sell any futures contracts. Futures trading involves significant risk and may not be suitable for all investors. Always conduct your own research and consult with a licensed financial professional before making trading decisions.