Introduction
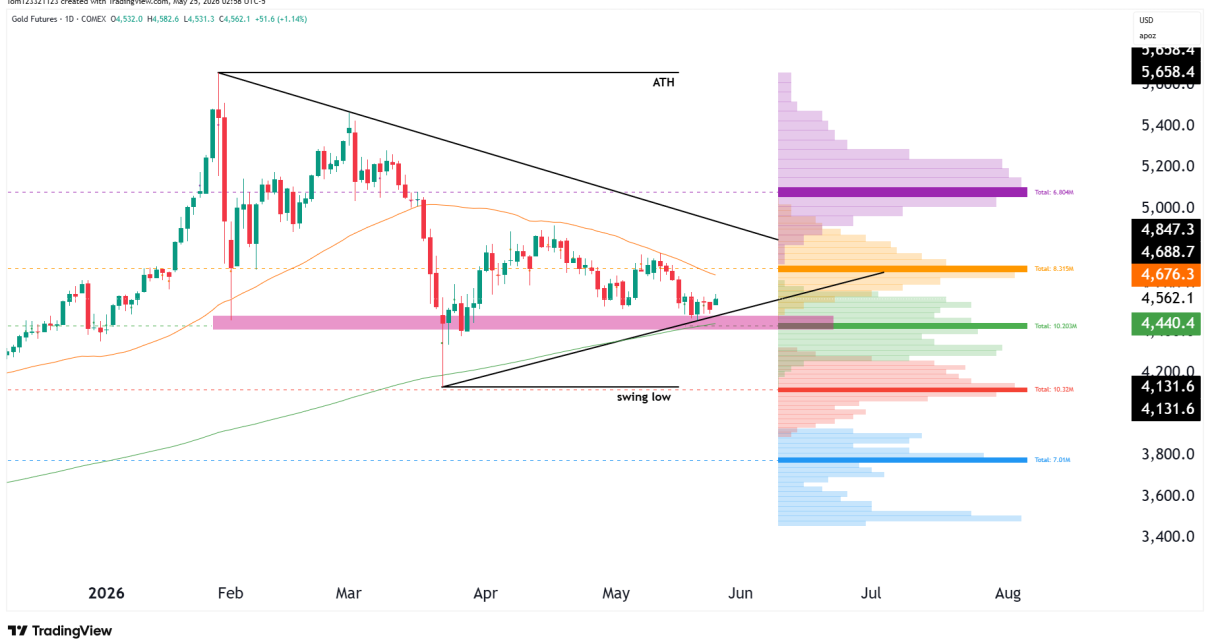
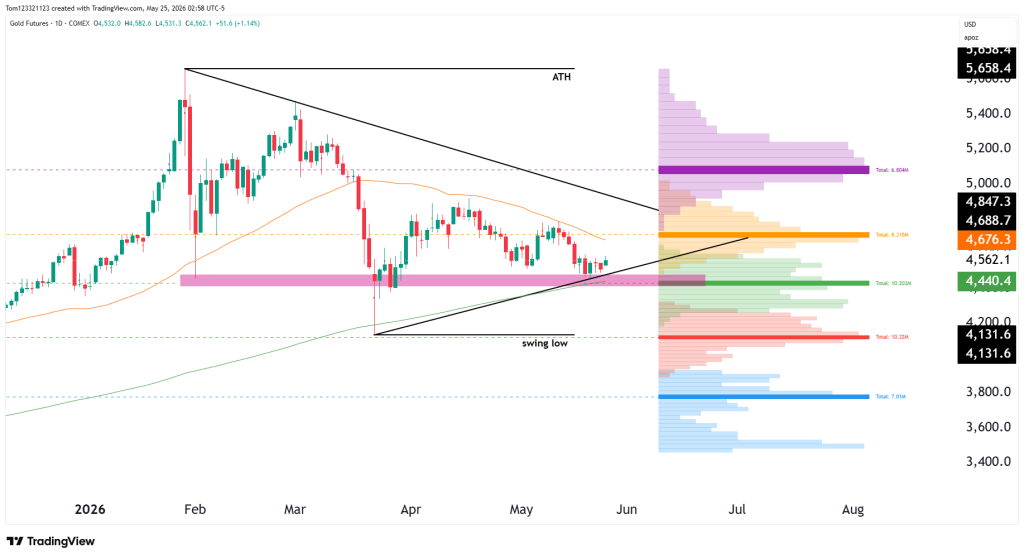
Gold futures could be forming a symmetrical triangle pattern as GC trades between major support near 4,440 and the descending trend line resistance from the February highs. After the explosive rally earlier this year that pushed gold into new all-time highs above 5,600, momentum has cooled as the conflict in the Middle East began.
The 200 moving average is being tested now, too, which should give some strength to the bulls. There are some numbers coming out later this week that the market will be watching, such as PCE, Q1 GDP second estimate, and Initial Jobless Claims, all on Thursday. These numbers shouldn’t have too much effect on the market, and right now, the technical levels give traders more to chew on.
GC Futures Trend Analysis
Current technicals show:
- The 50-day moving average near 4,688
- The 200-day moving average near 4,131
- Current price trading around 4,562
- Major support holding near 4,440
One of the most important technicals on the chart is the tightening triangle pattern currently forming between support and resistance. Price action has become increasingly compressed throughout May, so a larger directional move may be approaching soon.
The 4,440 support zone remains critical for bulls. This region has attracted buyers during pullbacks and aligns closely with one of the highest volume areas on the volume profile shown on the chart.
Volume Profile and Key Market Levels
Use Code TECHOUP for a 10% Discount!
The strongest high-volume support zone currently sits near 4,440. Another large volume cluster near 4,676 aligns closely with the declining 50-day moving average, creating an important resistance area overhead.
If GC can reclaim the 50-day moving average and break above the triangle’s resistance, momentum could shift back toward the bullish side.
Key Support and Resistance Levels
Major Resistance Levels
- 4,676 (50-day moving average)
- 5,000 psychological resistance
- 5,658 ATH
Major Support Levels
- 4,440 major support zone
- 4,131 swing low / 200-day moving average
- 3,800 longer-term support
Possible Trades
Bullish Breakout Trade
If GC can reclaim the 50-day moving average, we could see bullish momentum begin accelerating again. A successful breakout would likely strengthen the bullish structure, especially if buyers can push price back toward the 5,000 region and build momentum above recent lower highs.
Pullback Support Trade
As long as gold remains above the 4,440 support zone, buyers may continue stepping back in and buying it up. Bullish rejection candles near support, higher low formations, and momentum stabilizing above the 200-day moving average would continue supporting the longer-term bullish trend.
Bearish Breakdown Trade
If sellers manage to break price below the 4,440, we could see downside momentum increase quickly toward the swing low near 4,131. Continued weakness in safe-haven demand, rising yields, or a stronger U.S. dollar could all pressure gold lower in the near term.
Become The Next Funded Trader & Use This 10% Code:
This analysis is provided for educational and informational purposes only and should not be considered financial or trading advice. Trading futures, forex, and other leveraged financial instruments carries a high level of risk and may not be suitable for all investors. Past performance is not indicative of future results. Before making any trading decisions, conduct your own research, assess your risk tolerance, and consult with a qualified financial advisor if necessary.