

- Potential pennant/flag formation appears on the daily chart.
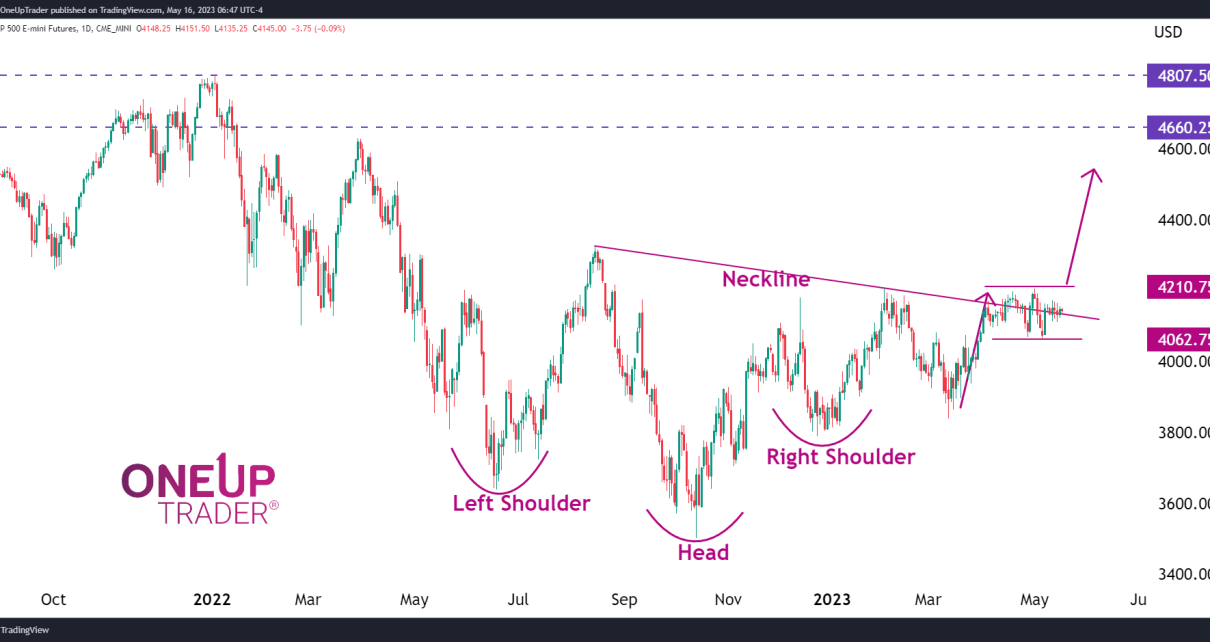
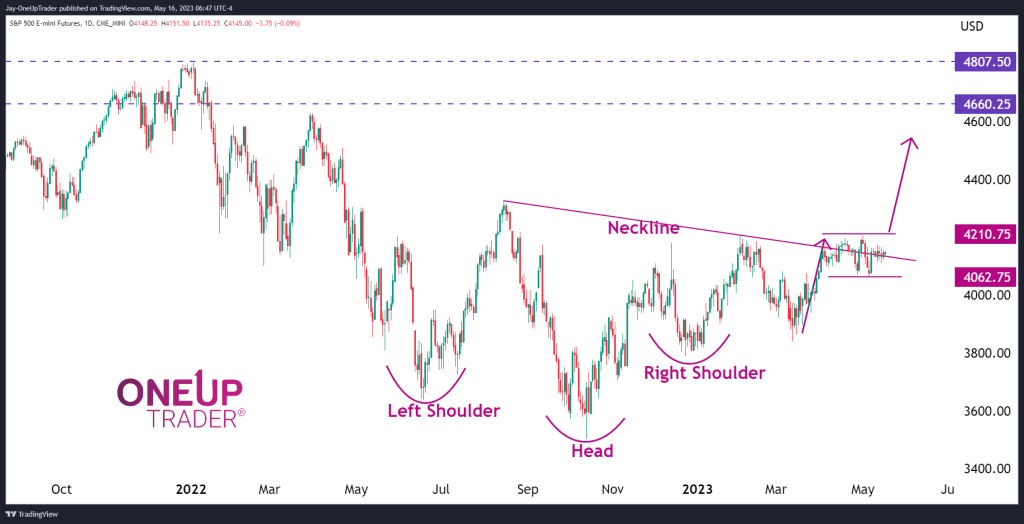
- Inverted head and shoulders is still in play and fueling bullish sentiment.
- Bullish trade ideas trump bearish ones.
Overview
ES has been stuck in a tight consolidation since the beginning of April. There was a steep move up just before the consolidation phase started, which leads me to believe we could be preparing for a bullish breakout. The range is between $4,062.75 and $4,210.75. The rally prior resembles a poll, so what we could have here is some sort of flag/pennant continuation formation occurring.
Let’s not forget about the inverse head and shoulders that we have been monitoring since April 3rd.
The neckline for this formation is currently being tested and has been held as support.
Trade ideas
It is important to note that price action has a bullish bias as long as it remains above $4,062.75. It would be a high risk to take short trades from these levels as there is no real evidence of bearish sentiment in the charts. Taking long trades from here appears to be the way to go. If the price breaks above $4,210.75 then we can be looking at a target of $4,600 in ES.