- A double bottom on the daily chart is driving bullish sentiment.
- Different entries and targets we can aim for and why shorts trades should be ignored for now.
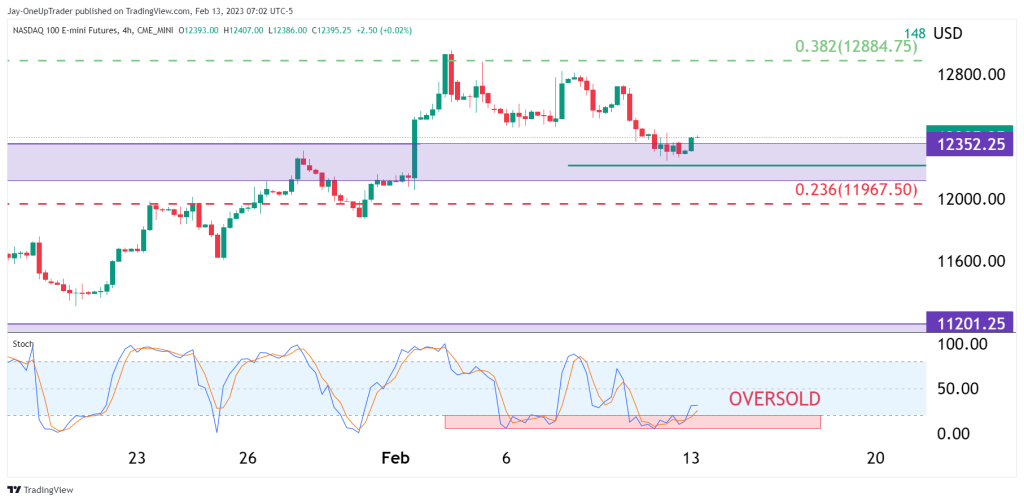
- How can we use a simple stochastic entry method in a shorter time frame.
Technical Analysis
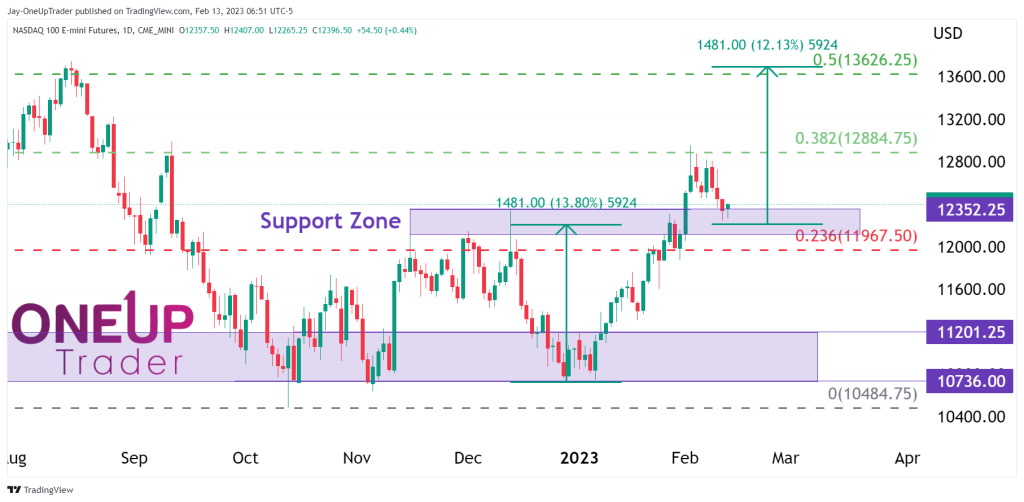
Double Bottom: NQ made a bottom back in October of last year, and price retested that low early last month. The bears were unable to send the market lower as sentiment shifted. Now, a month and a half later, price has rallied 23% since then, which, by definition, is the start of a bull market.
The neckline of the double bottom is around the support zone that I have marked on the chart below. Price has already cleared well above that level and has recently pulled back and is testing the zone as we speak. This gives a tremendous trade opportunity, probabilistically, of course. Nothing is certain. Looking at this chart, we can see, just based on this analysis, that bulls are in the driving seat.
My recommendation is that as long as price remains above $11,967.50, all short trades should be ignored, and traders would probably be better off taking long signals going forward. There is no need to fight the trend, and if we know what the long-term picture is, we can slide the scale of probabilities more in our favor, and thats what we should always be striving to achieve when it comes to financial markets.
Targets
Looking for targets, two things stand out for me. The double bottom extension which points toward the Fib 50% level at $13,600. It is a resistance level, and it’s 50% of the move from the high ($16,767) NQ made last year to the most recent low ($10,484) from October 2022.
Entries
Entries are pretty straightforward from here. In our last analysis on NQ, I showed that if we grind down to a 4-hour chart, we could simply wait for the stochastic to fall into oversold territory before initiating longs. That is where we currently are. If you do not like the stochastic indicator, then you can simply wait for today’s price action to confirm a candlestick reversal.
Remember that stop losses held too tightly could get triggered even if the direction is correct. That is why it’s always recommended that you give the trades enough room to breathe. Don’t choke them. If your hold stops too close, you are putting time against you. This means that not only do you need to be correct on the direction, but on the moment the move occurs too. An unnecessarily added hurdle that can be avoided.