- MACD crossover and strengthening histogram suggest a potential dollar index trend reversal.
- Inverse head & shoulders pattern forming on the 4-hour dollar index chart points to a potential breakout above $104.3.
- Emerging dollar strength signals headwinds for gold and equities, as a rising greenback tends to pressure commodities.
Introduction
The dollar is flat for the year after, at one point being down 4%, then swinging to the upside and gaining nearly 8% from the lows in July. The Fed’s stance indicates that we should see Dollar weakness, but what do the charts tell us?
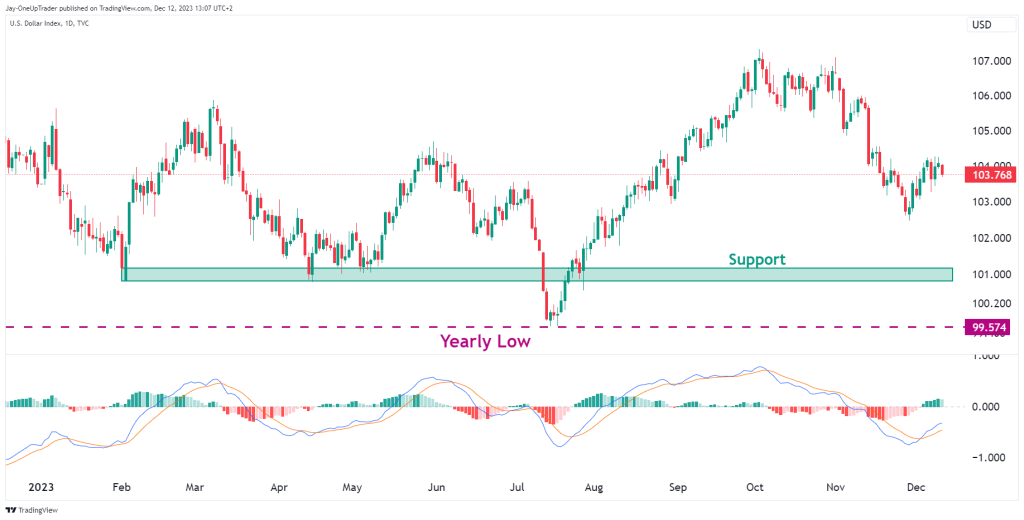
1-Year Daily Chart
Here is an improved version:
The MACD oscillator on the dollar index chart shows encouraging signs of a potential trend reversal, with the faster signal line crossing above the slower MACD line to trigger a buy signal – the first such crossover since July 2022. The green MACD histogram bars strengthening above the zero thresholds add conviction that bullish momentum is accelerating. Though dollar bears and gold bulls remain fixated on retesting the major $101 support, the improving MACD backdrop suggests the 2022 low could be defended. If the MACD continues trending higher within positive territory as the inverse head & shoulders pattern triggers, expect bears to reposition for considerably more greenback strength. A break below $101 would invalidate the constructive outlook. But the positive shifts in MACD alignment and RSI put the onus on sellers to prove they still have control of the long-term downtrend.
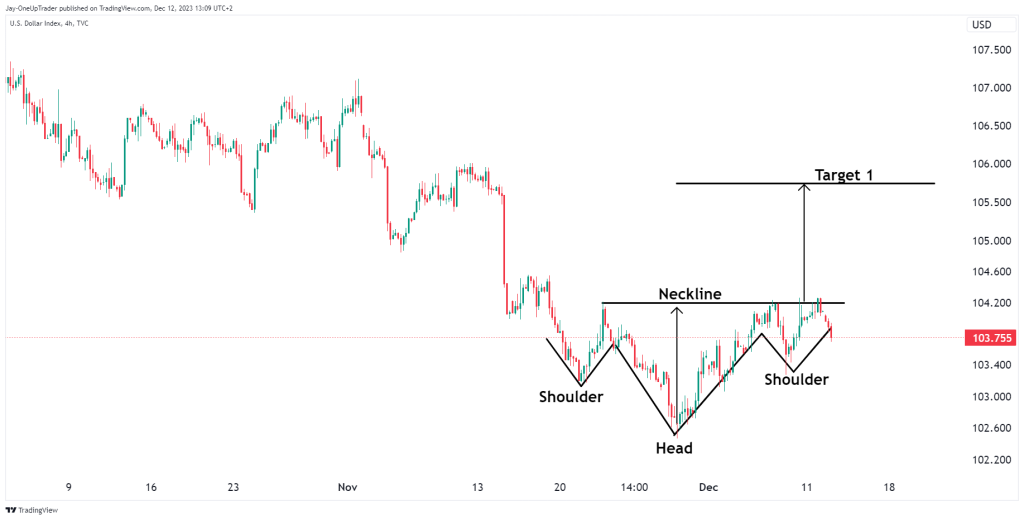
4 Hourly Chart
Here is an improved version:
Of the various dollar index (DXY) time frames, the 4 hourly chart reveals the most constructive potential reversal pattern for dollar bulls. An inverse head and shoulders appears to be taking shape, with the recent swing low forming the second shoulder. A decisive break and daily close above the $104.3 neckline could confirm the bullish pattern, projected to target the key psychological level at $105.5. Bulls will need to see significant upside follow-through once DXY clears resistance. Failure to break out could lead to retests of the 2022 lows.
What this means for Gold and equities
Here is an improved version:
The emerging technical pattern on the US dollar chart signaling additional strength does not bode well for gold bugs, as dollar rallies typically pressure gold prices lower. Equities also face headwinds from a surging greenback, as stocks priced in dollars become less affordable for foreign investors when the currency appreciates. However, if positive economic data and risk-on sentiment overwhelm the traditional inverse dollar relationships, markets could stage raging rallies to begin 2024. Gold may shine, and stocks may tear through to new highs despite the strong dollar if momentum and greed take hold.