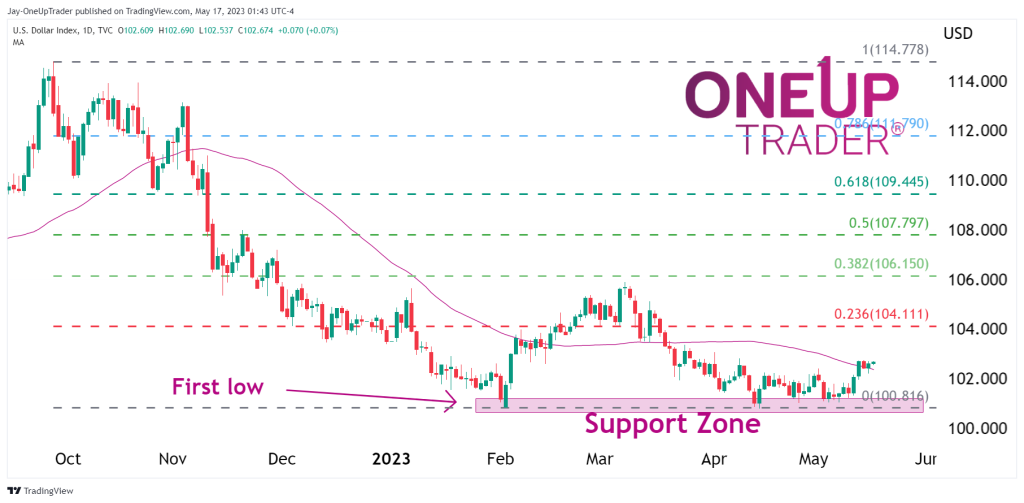
- The Dollar has found support at $100.8 and continues to rise.
- 50 ma, support zone, and Fibonacci retracements give a bullish bias for the Dollar in the short term.
- What this means for the general market.
The drop
The Dollar has fallen much of the year, with the greenback being down over 12% from the October 2022 high. The first low ($100.8) for the support zone was made in February, and price hasn’t broken below that level since.
Technical analysis
First of all, the support zone is holding the Dollar up for now. Only a drop below $100.8 would turn the market bearish.
The 50-moving average is being tested at the moment, but it shouldnt be too much of a hurdle for the bulls.
Targets for the greenback are $104, which is the 23% Fib retracement level.
What this means
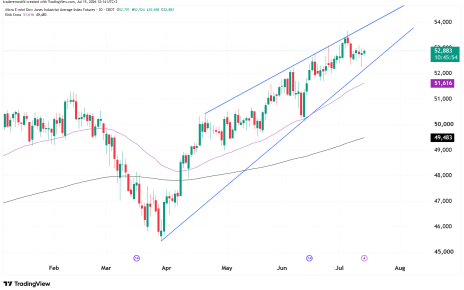
Generally, as the Dollar rallies, it is more difficult for other assets to rally since they are priced in Dollars. Looking at the equity charts, we can keep this in mind now as bearish divergence forms on NQ, ES consolidates, and YM drops.