- Gold has broken above the all-time high with power.
- Possible levels for bulls and bears.
- The importance of this week’s close.
Introduction
Last week, Gold was trending because of how close it was getting to breaking all-time highs. We finally saw that happen, and it was explosive. GC futures burst out of the all-time high, with the price surging 3.15% in 30 minutes. Let’s see what the technicals are telling us now and how we can position ourselves moving at the end of 2023.
Weekly Chart
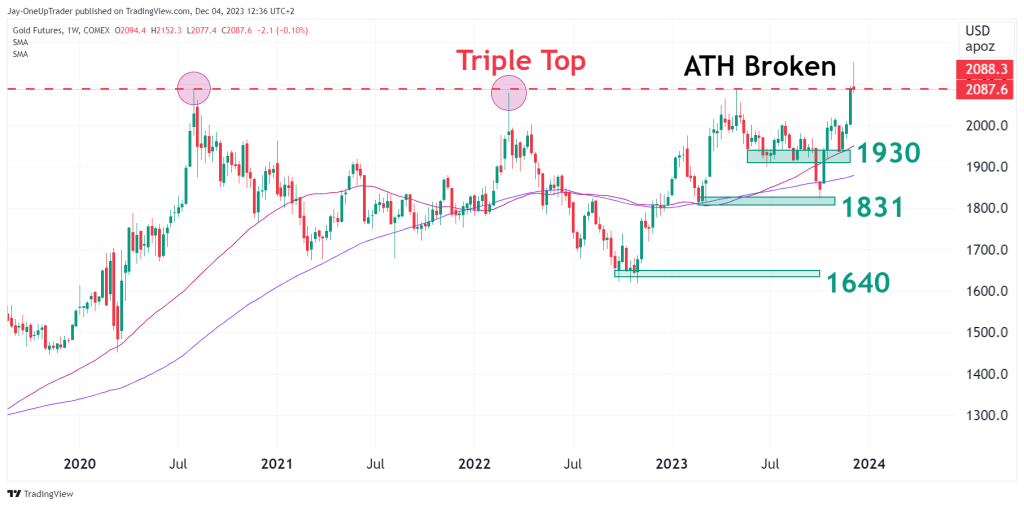
The triple top has failed for the time being. The first point (July 2020), the second point (June 2022), and the third and final top (December 2024). Now, with price having broken above this point, we can see the formation as a failure for the bears, but this week’s close is going to be vital. That’s because each time Gold made a high similar to this, we saw a 20% or more retracement from that level. Traders who are long Gold should maintain strict stop-loss positions in case this happens again.
Daily Chart
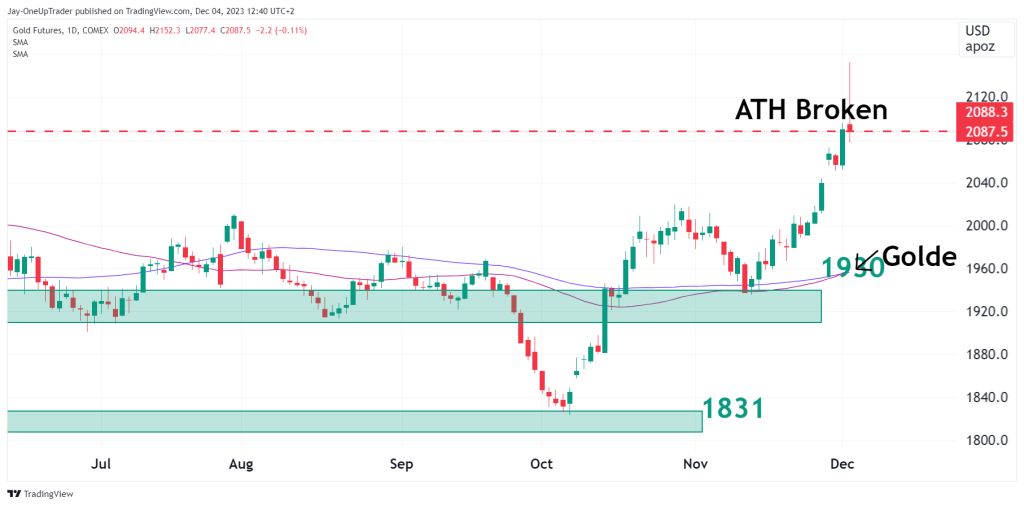
One clear bullish sign on the daily chart beside the all-time high being broken is the golden cross formation. This is where the 50 moving average crosses above the 100. This is the first golden cross since July. One thing bulls need to watch is the candle for today. It is currently looking like a huge inverted hammer, but its better we wait for the end of the week to see the weekly close before looking at possible trades.
Levels To Watch
The most obvious level is the previous all-time high of $2060.80 which could act as support from here. The next level is the high made time at $2152.3, if that is broken this week it’s a bullish sign. If prices fall from here, the most immediate support would be the 50-moving average and the support zone at $1930.