

4 minute reading time
Introduction
Crude oil futures are back at $100 after an oil tanker exploded in the Strait of Hormuz. Read the full story here.
In our October 12 analysis, we highlighted a developing bull flag and identified $93.68 as the upside trigger to watch. The recovery has since extended, bringing the September highs back into focus. The exploding oil tanker has made the bull flag even stronger now and time will tell if we see price move above the March 9th peak of $119.
CL is trading around $99.90–$99.96, above both moving averages and the rising trendline. Buyers have regained control of the near-term trend, but they still need to clear the recent highs around $100–$102 before a retest of $106.75 becomes more likely.
Daily Chart: Buyers Defend the Rising Trend
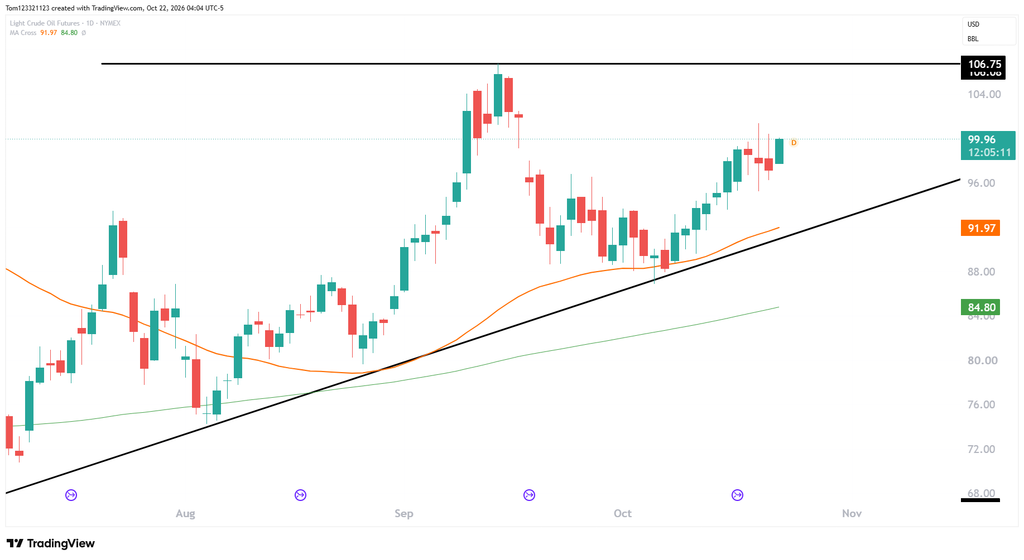
The October recovery started after price tested the $87–$89 area, this is the rising trend line which started from the beginning of July. There was also support off the 50 day moving average.
From here, the main focus point is what happens in the Strait of Hormuz; if it remains closed and supply disruptions continue, then it is more likely than not that we see an eventual test of the $106.75 resistance level.
The Bigger Picture: $106.75 Is the Main Test
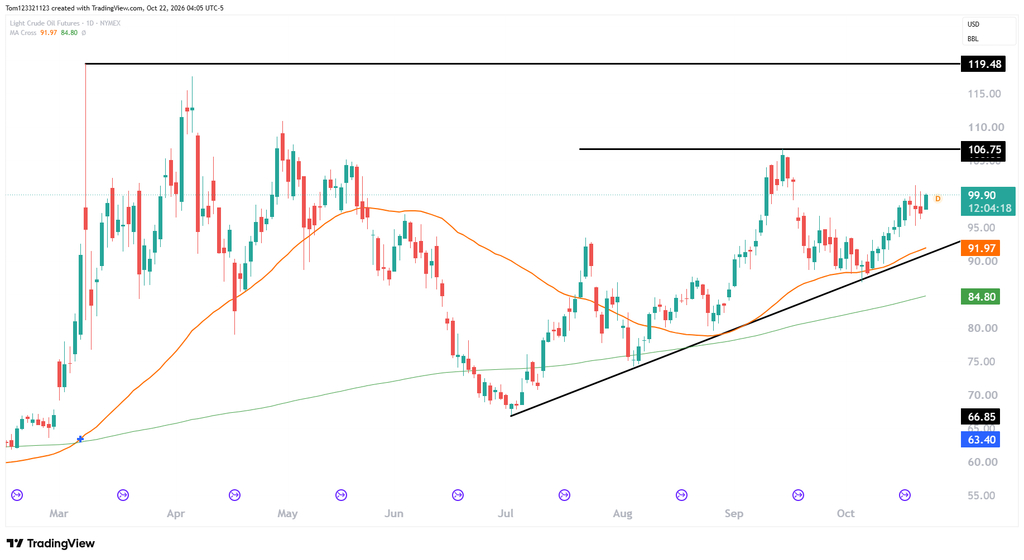
Key Levels
| Price area | Role |
|---|---|
| $119.48 | Major overhead resistance |
| $110–$115 | Higher resistance area |
| $106.75 | Main breakout level |
| $100–$102 | Immediate resistance |
| $95–$97 | First pullback support |
| $91–$92 | Deeper support |
| $87–$89 | Important structural support |
| $84.80 | 200 day moving average |
Possible Trades
Bullish continuation: A daily close above the recent highs around $102, followed by a successful retest, would strengthen the case for a move toward $106.75. Holding above $100 alone would be encouraging, but buyers still need to overcome the selling just above it.
Buying a pullback: If crude retreats first, $95–$97 is the nearest area to monitor. An hourly higher low followed by a break above the rebound high could provide an entry signal, with the stop below the low supporting that setup. The distance to the first resistance should justify the risk.
A deeper correction: Losing $95 and failing to recover it would increase the chance of a test near $91–$92. A sustained break beneath the rising trendline and the $87–$89 October base would materially weaken the bullish structure.
The recovery has progressed well since our previous analysis. The focus now is whether buyers can turn the return to $100 into a sustained move toward $106.75, and the developments in the Middle East weigh heavily on this.
This analysis is for educational and informational purposes only and does not constitute trading advice or a recommendation to buy or sell any futures contracts. Futures trading involves significant risk and may not be suitable for all investors. Always conduct your own research and consult with a licensed financial professional before making trading decisions.