Introduction Technicals on the Euro have once again shown that the range the price has been stuck in is a very difficult one to break. 6E futures have painted 16 red sessions in the past 18 as the Dollar staged a comeback. Some investment banks are becoming bearish on the Euro as Donald Trump leads Read More…
Introduction The technical analysis we did a few days ago for ES has now been confirmed, and we are looking like the next upside rally is here. The daily chart confirmed the breakout with a strong bullish close above the previous high, and as long as prices remain above that, bulls should have the upper hand. Read More…
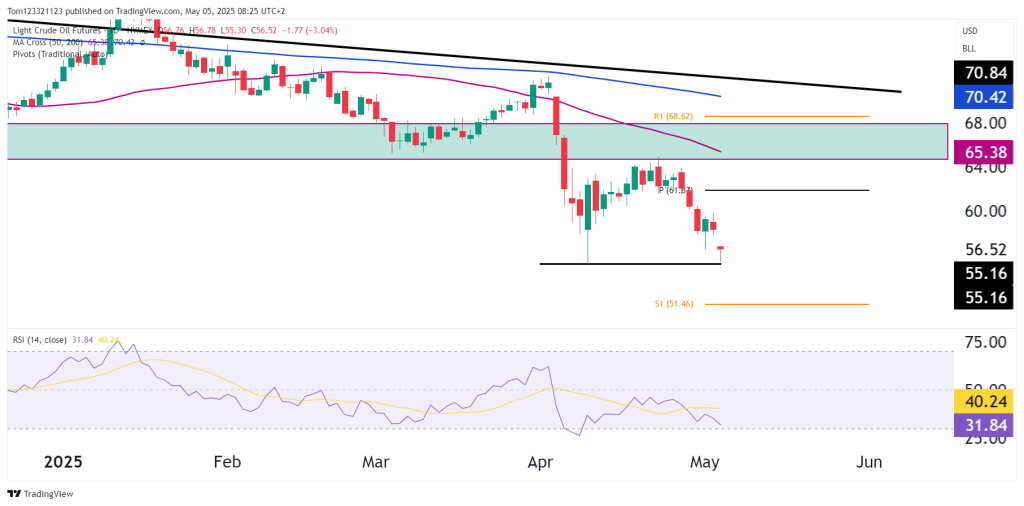
Overall Trend Remains Bearish As Momentum Indicator Continues To Slump Analysis Of Parallel Channel, Moving Average Band, And Momentum Indicator Potential Game Plan As Euro Continues To Slide Bearish Trend Continues There is not much change in the daily chart from when we previously analyzed 6E back in September. We were looking primarily at taking Read More…


