Introduction
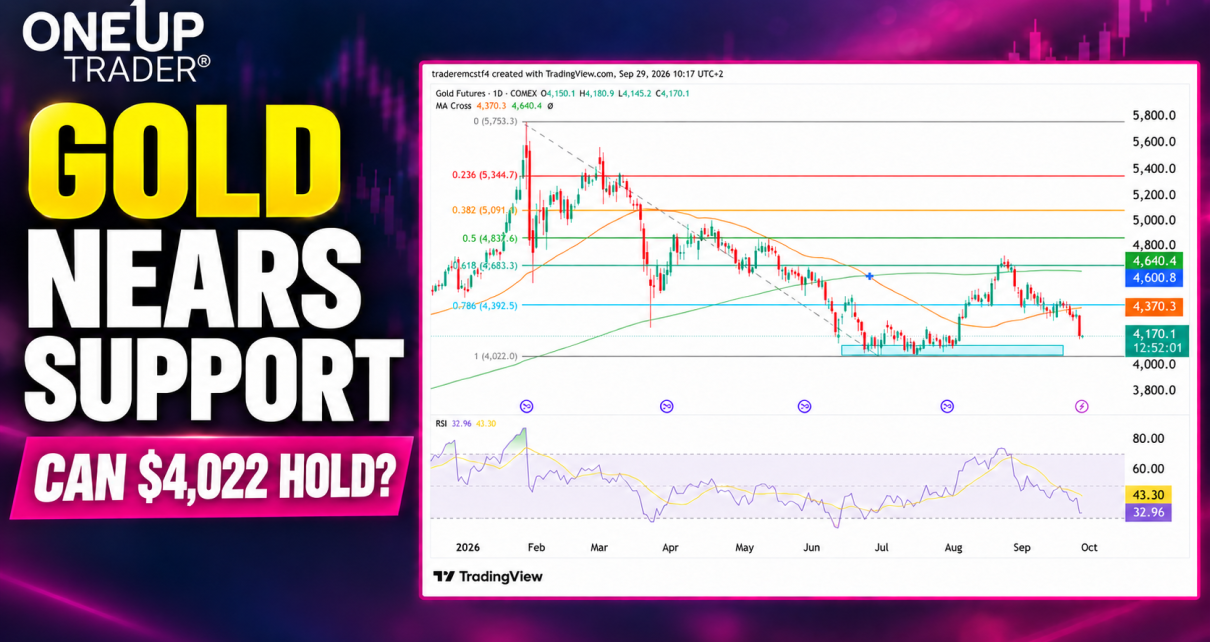
Gold has given back most of its August recovery and is approaching the support area that held through June and July. Price is trading around $4,170 on the September 29 daily chart, below both moving averages, with sellers now in control again. The gold bulls are scrambling because there looked like a strong chance that the downtrend we saw since early Feb was coming to an end, especially when we saw price trade above the 200 day moving average.
The main question now is whether buyers can defend $4,022–$4,100 again. If this level does hold, it could be a very strong long entry for the medium and long term.
Gold is being pulled in two opposite directions by the Middle East situation right now.
Normally, escalating geopolitical risk is bullish for gold because investors move toward safe-haven assets. But the current conflict is also pushing oil sharply higher, and that second-order effect has recently been more important. Brent is around $106/barrel, while disruption and tension around the Strait of Hormuz are keeping energy-risk premiums elevated. Reuters
Higher oil → higher inflation expectations → expectations that the Fed keeps rates high or hikes again → higher Treasury yields + stronger USD. Those conditions are bad for gold, because gold pays no yield and becomes relatively less attractive when bonds are offering more. The U.S. 10-year yield has approached 5.27%, its highest level in about 19 years.
Daily Chart
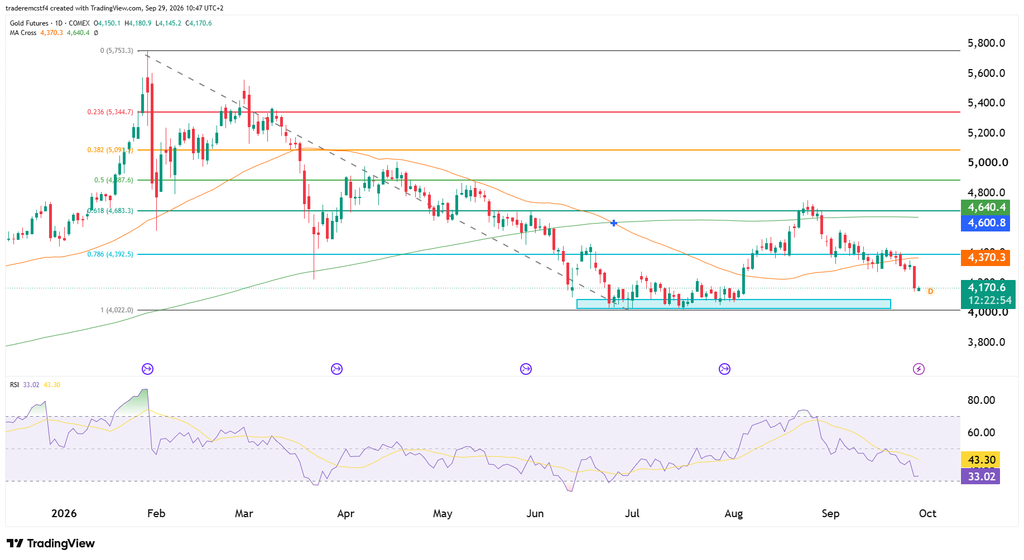
The August rally stalled near the 61.8% Fibonacci level at $4,683. Since then, gold has slipped back below the green 50-day moving average at $4,640 and the orange 200-day moving average at $4,370.
The latest selloff has also taken price below $4,392, the 78.6% Fibonacci level. Together with the orange moving average, this creates a resistance zone around $4,370–$4,395. Buyers would need to reclaim this area to show that the recovery is gaining strength.
As we mentioned, the $4,022–$4,100 zone is becoming extremely important for gold bulls. It is the make-or-break level.
Key Levels
| Level | Importance |
|---|---|
| $4,640–$4,683 | 50-day moving average and 61.8% Fibonacci resistance |
| $4,370–$4,395 | 200-day moving average and broken 78.6% Fibonacci level |
| $4,022–$4,100 | Main summer support area |
| $4,000 | Psychological level below the range |
Possible Trades
Support long: Watch for a bounce out of $4,022–$4,100, followed by an hourly higher low. Place the stop below the rejection low, with potential targets around $4,250 and $4,370. This would be a countertrend trade, so confirmation is important.
Rally short: If gold rebounds into $4,370–$4,395 and forms a bearish rejection, watch for an hourly lower high. The stop goes above the rejection high, with targets around $4,200 and $4,100.
At $4,170, price is already approaching support, which reduces the room available for a fresh short. The clearer opportunities would come from a confirmed support reaction or a rally back into resistance.
Take advantage of gold in a oneup trader funded account
This analysis is for educational and informational purposes only and does not constitute trading advice or a recommendation to buy or sell any futures contracts. Futures trading involves significant risk and may not be suitable for all investors. Always conduct your own research and consult with a licensed financial professional before making trading decisions.