- Weekly chart analysis shows mixed possibilities.
- Daily chart analysis tells us to stay away from 6E for now.
- Trending RSI confirms the recent downtrend can last for a while longer.
Weekly Chart
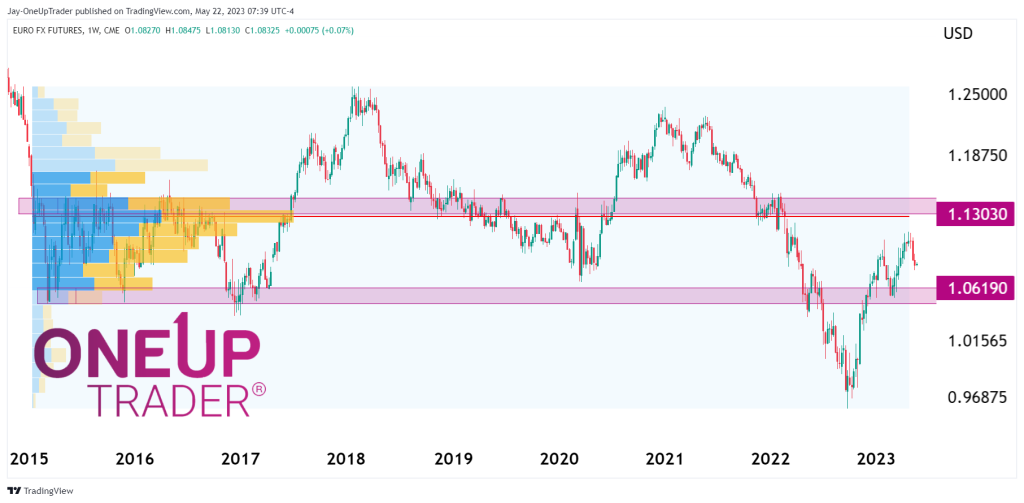
I applied the volume profile indicator to the weekly chart starting from the lows made in 2015. The point of control is resting at 1.13, which tells us that the most volume traded was at that price. If we see the Euro rally from here, we will set that as our first bullish target. A drop from here brings the support level at 1.06 into play, then.
As FOMC minutes come in this week, we will get a better idea of the direction of the Dollar, which will give us more insight into the movements of the Euro.
Daily Chart
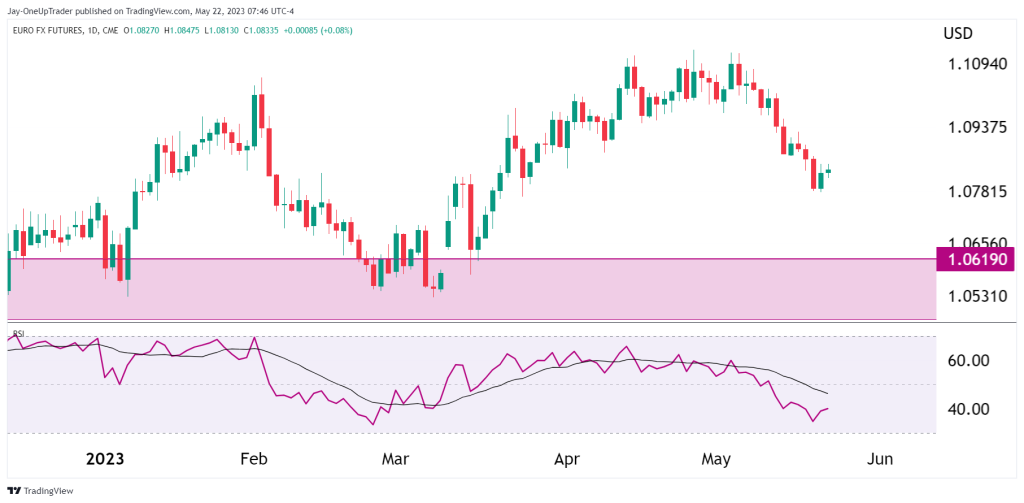
The daily chart momentum is to the downside, and it doesn’t show any sign of stopping now. The trend is smooth, and the RSI is approaching oversold. When the RSI approaches oversold in a smooth downtrend, then it’s a bearish sign, and we do not consider the price as oversold. When the price action is very steep and the RSI is oversold, then we consider it as oversold.
What to do?
From here on, I would stay away from trading 6E especially since FOMC is coming this week. Once we get a better idea of the direction after FOMC, can we make our decisions. We need to watch if the Euro will approach the support zone at 1.06 for us to consider going long. If we form a double bottom in the next few weeks or some reversal pattern like that, we can also look at initiating a long position.