


- Gold prices on the rise due to dollar weakness.
- The yellow metal might go higher still if the Federal Reserve becomes less hawkish.
- The Fed’s Daly is open to a more significant rate hike than the expected 50bps.
Broader dollar weakness has left the bullion on course for its fourth consecutive weekly gain. US gold futures fell 0.2% to $1,803.10. Prices fell on Friday as the opportunity cost of owning non-interest-bearing gold increased. U.S. 10-year Treasury yields lingered close to a three-week high.
Data released on Thursday revealed a sudden decline in U.S. producer prices in July. The announcement that consumer prices (CPI) remained unchanged in July due to falling gasoline prices had been released the day prior. Peaking and possibly dropping inflation would mean a less aggressive Fed and a weaker dollar, which would boost the yellow metal.
However, more economic releases will come before the next FOMC meeting, which could warrant a more significant rate hike. Given the most recent economic statistics, particularly data on inflation, San Francisco Federal Reserve Bank President Mary Daly said a 50bps rate hike in September “makes sense.” Still, she is open to a more considerable rate hike if the data merits it.
Rising US interest rates significantly impact the price of gold because they raise the opportunity cost of owning non-yielding metal. Gold is also higher because the dollar lost ground to its competitors for the third consecutive week. Dollar-denominated gold is more affordable for other currencies when the dollar is weaker.
Meanwhile, Goldman Sachs cut its price forecasts for gold, saying that “structurally, gold is likely to remain range-bound as growth and tightening factors continue to offset each other.”
Gold (G.C.) futures technical outlook:
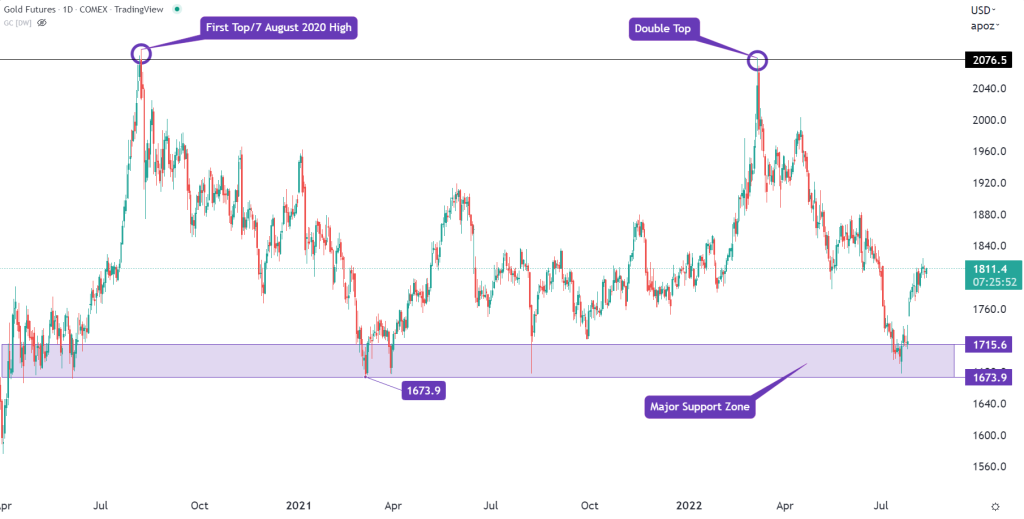
Gold has been consolidating for nearly two years now, with a very noticeable double top that formed, with the two peaks being August 7, 2020, and the second being March 8, 2022. The wide band has seen prices as high as $2088 an ounce and as low as $1673.9 an ounce.
There is a major support zone between $1673.9 and $1715.6 that prices recently tested, bulls stepped in, and the price rallied swiftly to $1811, which is today’s trading price.
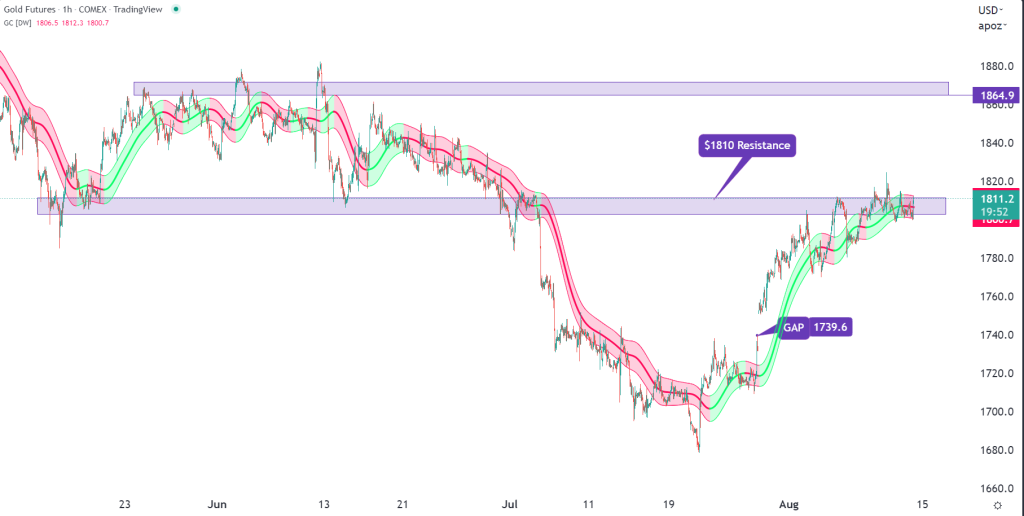
Looking at the hourly chart, prices currently find some selling pressure at the $1810 Resistance level. This indicates that if bulls cannot break through this level, we could see prices retrace down to fill the gap formed on July 27.
A rally would mean we could see prices move to the next level on our chart, which is $1864.9. We also have a gaussian channel on the hourly chart, which has been trending solidly with clearly defined higher highs and higher lows.
Gold, however, is very susceptible to what the dollar does and the Fed’s plans regarding monetary policies in the future.
