

Introduction
Crude Oil has fallen below $87 a barrel as there are growing hopes of a possible diplomatic resolution to the Middle East conflict and easing concerns over global oil supply disruptions.
The last time we looked at CL was November 3rd, and the chart looked far more bullish than it does today. It’s another reminder that oil is driven mostly by the Middle East conflict right now, and something traders should keep in mind. The technicals can give us certain levels, targets, and stop losses to mark, but ultimately the fundamentals matter more. So before we dive into the technicals, remember to manage your risk effectively.
Technical Analysis
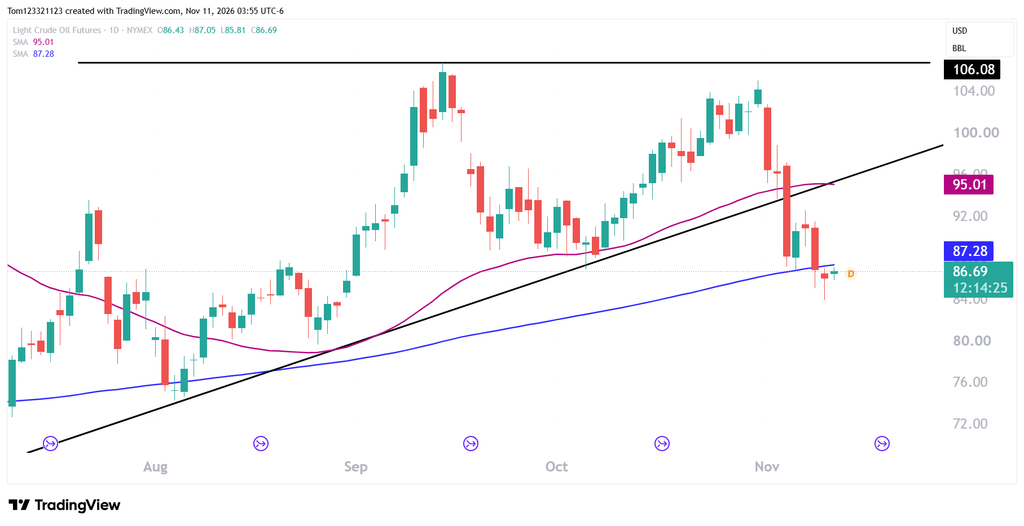
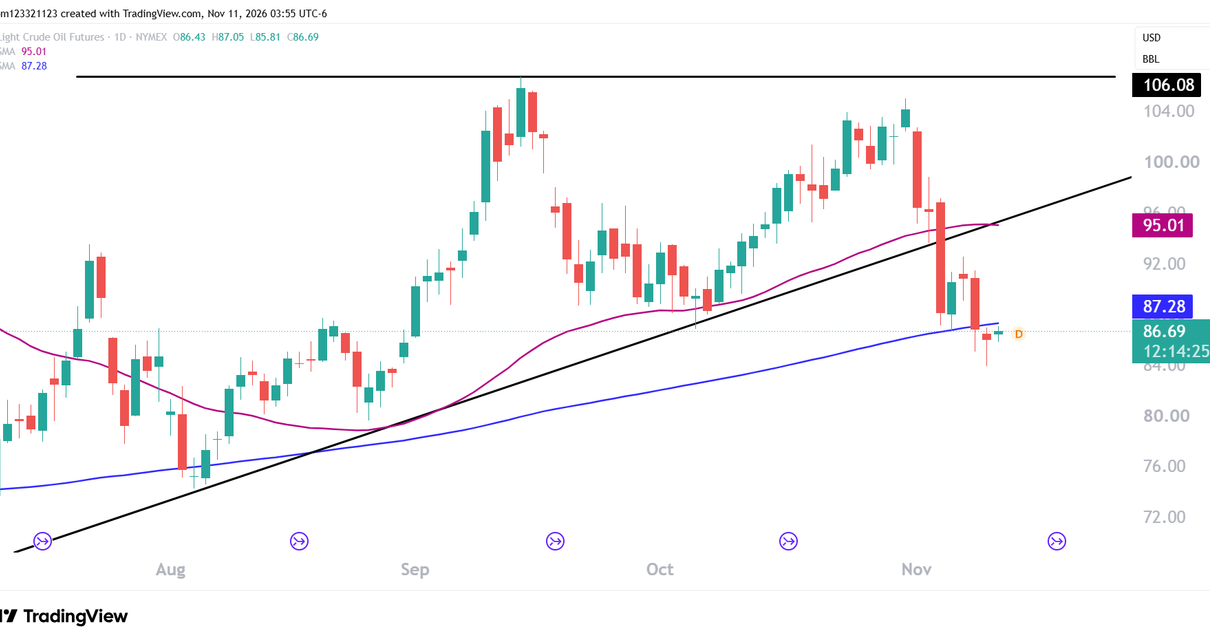
CL is testing the 200-day moving average for the first time since August. The 50 MA was not able to hold the price up this time as well as the ascending trend line. The difficulty in analysis crude oil now is the high volatility, we are seeing fast swift rallies followed by quick drops and then v-shape recoveries.
The daily candlestick from the 10th of November is a bullish formation, which, if today’s session (11 November) forms a green day, could be a morning star bullish reversal pattern. Pairing that with the test of the 200-day MA, and the market being oversold too, could mean a long entry is possible.
CL possible trades
Long trade: Enter on confirmation of a green day in the 11th November session, with stop loss below 83.88. Target can be set at the 50 day MA.
Short trade: Null.
Disclaimer: Educational content only; no personalized investment or trading recommendation is intended. Futures carry substantial loss risk and may be unsuitable for some traders. Examples are hypothetical and do not predict results. Stop orders cannot guarantee an execution price. Evaluation requirements and payout terms vary and may change; consult the provider’s current rules.