Introduction
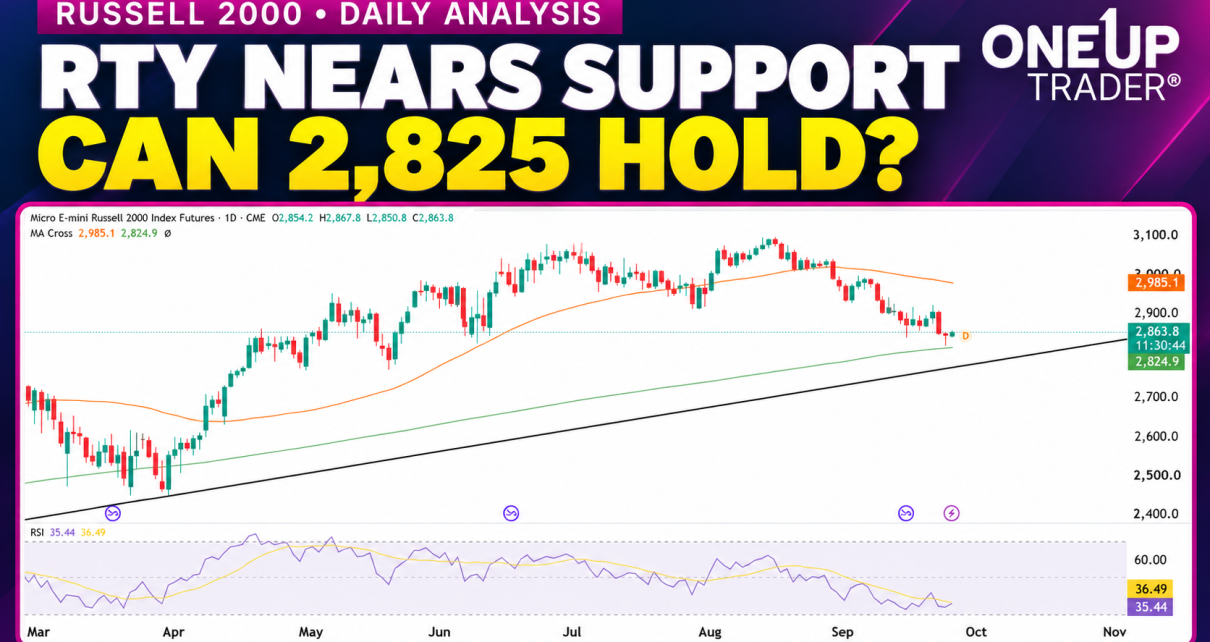
Russell 2000 futures have pulled back from the August high near 3,100 and are now approaching the 200-day moving average around 2,825. Price is trading at 2,863.8, but sellers are still in control.
The recovery from the March lows has not completely broken down, but buyers need to start defending these lower levels. Can support produce a meaningful bounce, or will the correction extend toward the rising trendline? With NQ and ES trading near all-time highs, RTY is lagging behind. The S&P 500 is up over 1% for the month, while the Russell is down over 5%. So, is it time we see a resurgence in the small caps?
Daily Chart
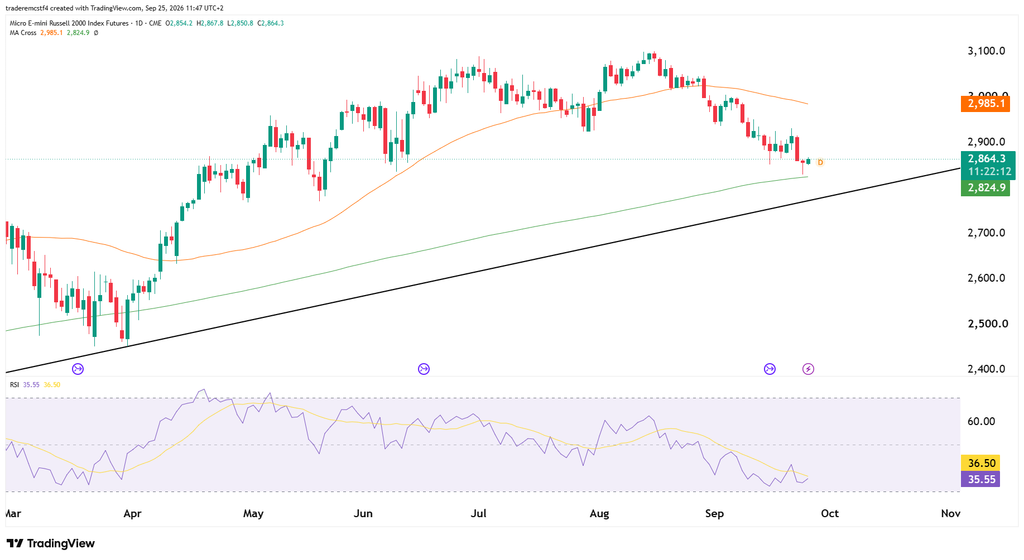
Since the August high, RTY has formed a series of lower highs and lower lows. Recent recovery attempts have failed, while the 50 moving average at 2,985.1 has turned lower and remains well above price. The last time we saw this was in March, and after that we saw a big rally in RTY.
The first support area to watch is 2,820–2,830, around the rising green moving average. A bullish reaction here could give buyers an opportunity, although reaching a moving average alone does not confirm a reversal.
Below that, 2,780–2,800 becomes the next important area. This includes the May swing-low region and the drawn rising trendline, which sits around 2,780 at the current date. The trendline remains below price and has not yet been tested during this decline.
For the bulls, 2,900–2,930 is the first resistance zone to recover. Holding above it would change the short-term trend of lower highs and open room toward 2,985–3,000. Until then, a bounce could still become another selling opportunity.
Start Your Evaluation Today!
Possible Trades
- Support bounce: Watch for a bullish rejection around 2,820–2,830, followed by an hourly higher low. Place the stop below the reversal low, with 2,900 and 2,930 as potential targets.
- Failed recovery: A bounce into 2,900–2,930 that forms another hourly lower high could offer a short. Place the stop above the rejection high, targeting 2,860 and then 2,825.
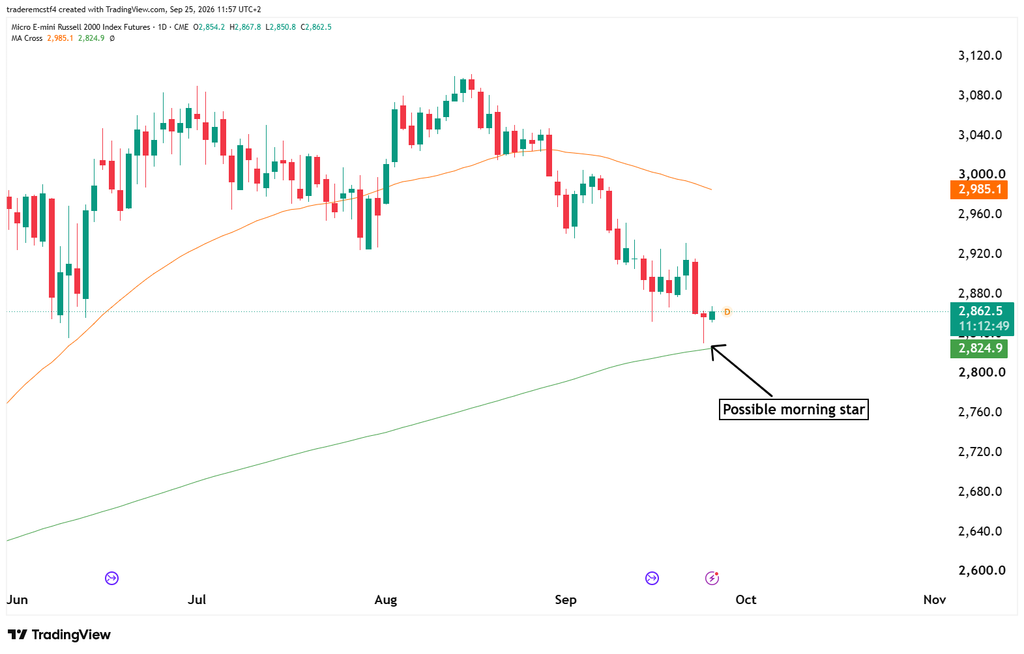
The possible morning star candlestick pattern on the daily chart is also a good sign for the bulls. We can keep an eye on it, and if it confirms, it adds to the bull case in the short term.
Both setups need confirmation and enough room to the first target to justify the stop. Today’s candle is still open, so the small green reaction has not yet changed the bearish short-term structure.
This analysis is for educational and informational purposes only and does not constitute trading advice or a recommendation to buy or sell any futures contracts. Futures trading involves significant risk and may not be suitable for all investors. Always conduct your own research and consult with a licensed financial professional before making trading decisions.