Introduction
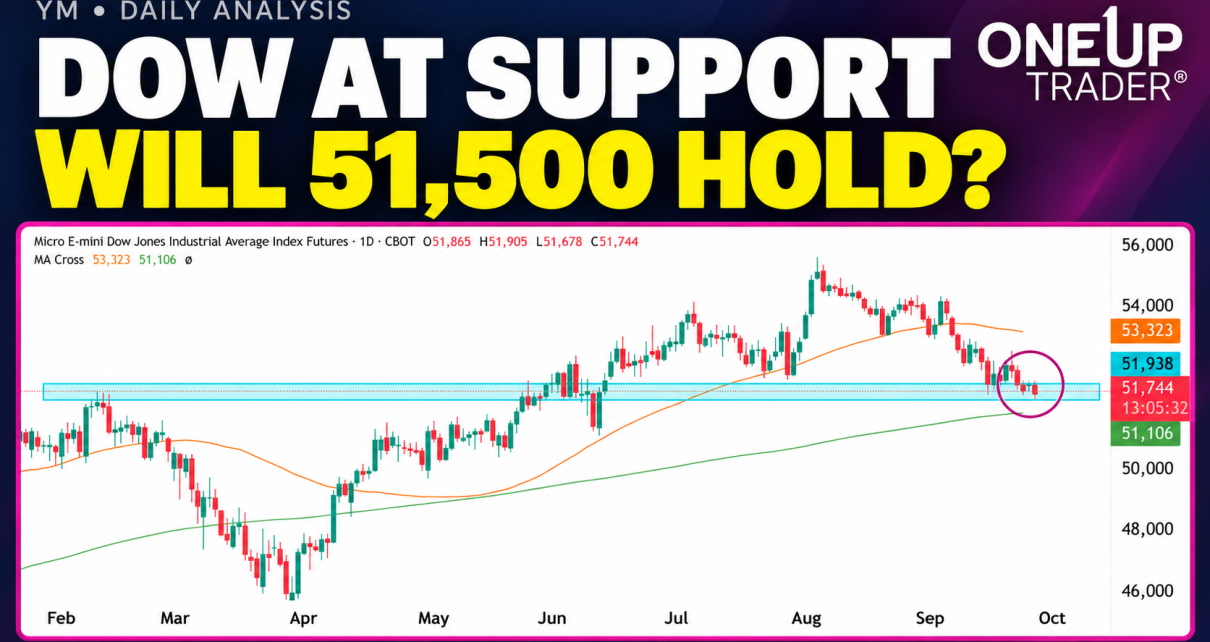
Dow futures have given back much of their summer rally and are now testing an important support area around 51,450–51,950. With price at 51,744 on the chart, buyers have an opportunity to defend the level, but we have yet to see a convincing reversal.
The question now is whether this becomes a base for a recovery or another pause before the next move lower.
Daily Chart
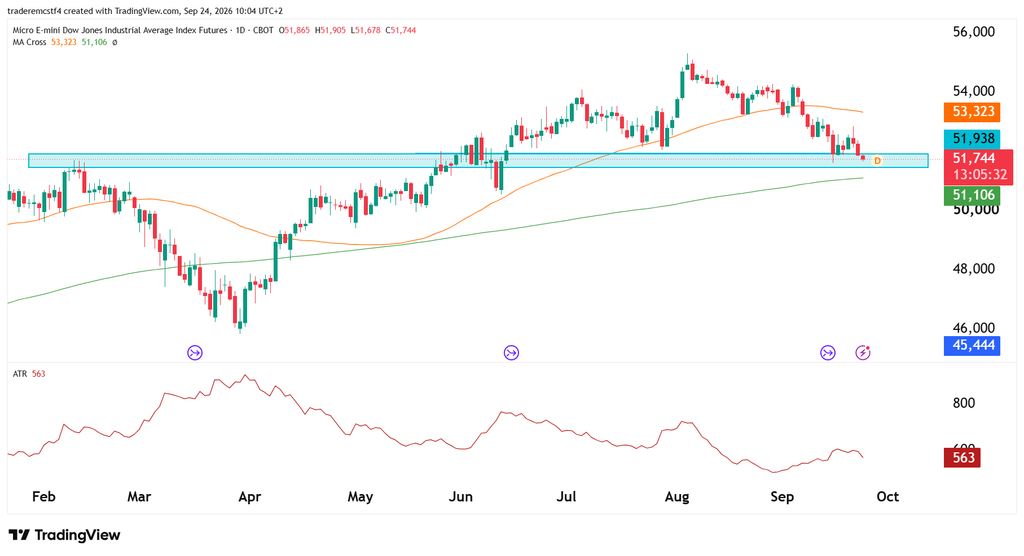
The highlighted zone acted as resistance in February and became a busy trading area during the June breakout. Price has now returned to it after forming lower highs and lower lows from the August peak near 55,200.
That puts the short-term advantage with sellers. The orange (50) moving average at 53,323 has also started turning lower, and recovering that level would be an important step toward repairing the bullish picture.
There is still support underneath, however. The longer moving average continues rising near 51,106, giving buyers another reference if the highlighted zone fails. A daily close below 51,450, followed by an unsuccessful attempt to reclaim it, would bring that average into focus. Below 51,100, the next areas to watch are 50,500 and 50,000.
For a bounce to develop, bulls first need to recover 51,950–52,000 and hold it on a retest. That would open room toward 52,500–52,700, followed by the moving average around 53,300. A move through 54,000 would provide stronger evidence that the broader correction is ending.
Possible Trades
- Support bounce: Look for a reclaim of 52,000 followed by a higher low on the hourly chart. A stop belongs below the confirmed reversal low, with 52,600 and 53,300 as potential targets. Skip the entry if the stop leaves too little reward to the first resistance.
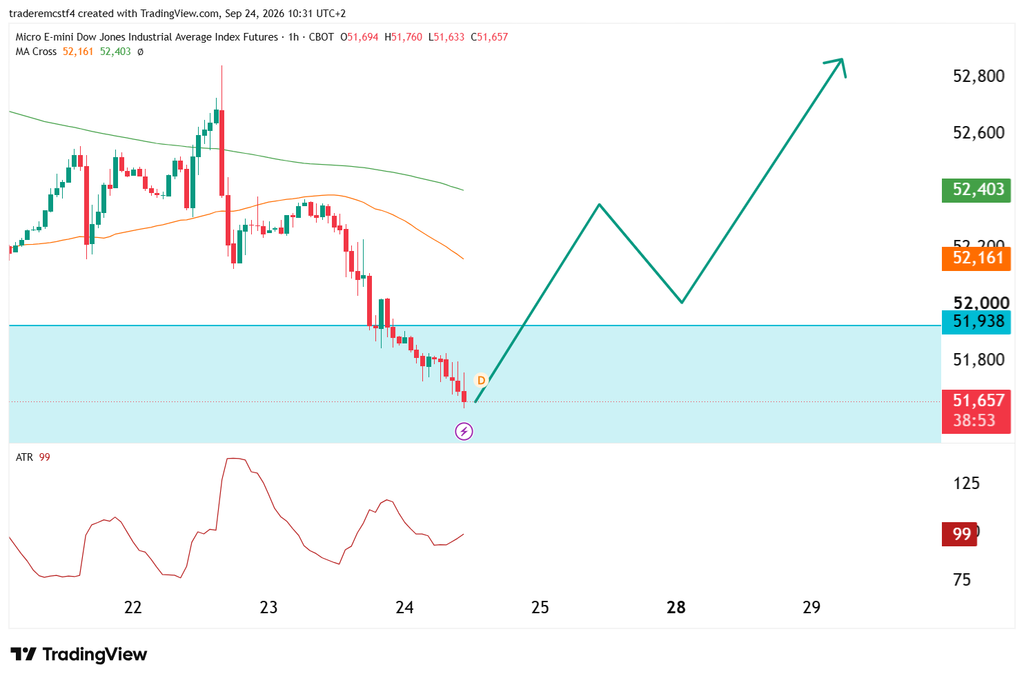
- Support breakdown: A daily close below 51,450, followed by a failed retest from underneath, could offer a short. Place the stop above the retest high. Watch 51,100 first; a break there would open 50,500.
Daily ATR is around 563 points, so stops and position size need to allow for substantial movement. ATR measures volatility rather than direction; it does not confirm that support will hold.
With today’s candle still open, the reaction around this zone matters more than the fact that price has reached it.
This analysis is for educational and informational purposes only and does not constitute trading advice or a recommendation to buy or sell any futures contracts. Futures trading involves significant risk and may not be suitable for all investors. Always conduct your own research and consult with a licensed financial professional before making trading decisions.