Introduction
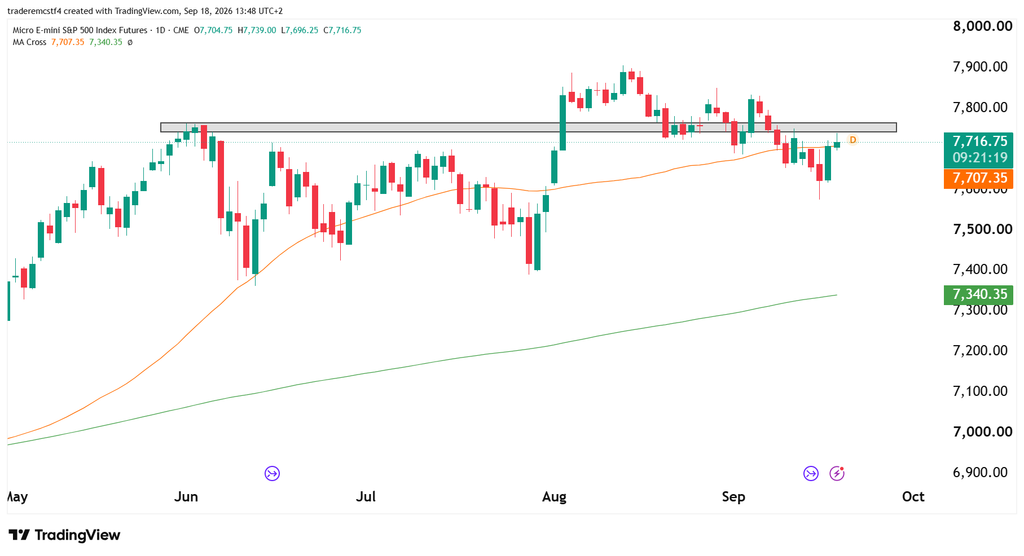
The S&P 500 is testing the 50-day moving average after a small pullback of 4% since the end of August. We are looking at a market that is bullish long-term and requires finding the bottom or waiting for confirmation that the trend has reversed. With some big tech names coming out with earnings in the next few weeks, the market could get the boost it needs to approach all time highs again.
Let’s take a closer look at the technicals and what they are telling us.
| Price zone | Role | Technical significance |
|---|---|---|
| 7,880–7,905 | Major resistance | August peak area and the upper boundary of the visible advance. |
| 7,800–7,830 | Secondary resistance | Recent rally highs; the next hurdle after a successful reclaim. |
| 7,740–7,765 | Key resistance | Highlighted former support, now the main test for the rebound. |
| 7,690–7,710 | Immediate pivot | Current moving-average area and the latest session’s low. |
| 7,580–7,620 | Key downside support | This week’s low and the starting area of the rebound. |
| 7,500–7,540 | Deeper support | Repeated June–July trading activity. |
| 7,380–7,420 | Major structural support | June and late-July swing lows. |
The bullish setup requires buyers to recover the whole resistance zone. A daily close above 7,765, followed by a pullback that holds around 7,740–7,765, would suggest the recent breakdown is failing. That would improve the case for a move toward 7,800–7,830, with 7,880–7,905 becoming relevant if buyers also overcome the September highs.
A brief push into the shaded area would offer less confirmation. If price repeatedly reaches resistance but closes beneath it, sellers are still defending the level. Sustained trading back below 7,740 after a breakout would weaken the reclaim setup.
The bearish opportunity would develop if the rebound stalls at resistance and price subsequently loses 7,690–7,700. A lower high on the one-hour or four-hour chart would help confirm that rejection, bringing 7,580–7,620 back into focus. A daily close beneath that support would extend the correction toward 7,500–7,540. Sellers would need to reassess if price instead holds above 7,765.
For fresh longs, entry location matters: the first resistance sits only about 20–45 points above the displayed price, while this week’s low is more than 100 points below it. Using that distant low as a stop would leave an unfavorable reward-to-risk ratio to the first obstacle. A confirmed breakout and retest, or a clearly defined higher low, would offer a more useful basis for evaluating risk.
Start Your Evaluation Today!
This analysis is for educational and informational purposes only and does not constitute trading advice or a recommendation to buy or sell any futures contracts. Futures trading involves significant risk and may not be suitable for all investors. Always conduct your own research and consult with a licensed financial professional before making trading decisions.