


Follow-Up: What Played Out Since August 3
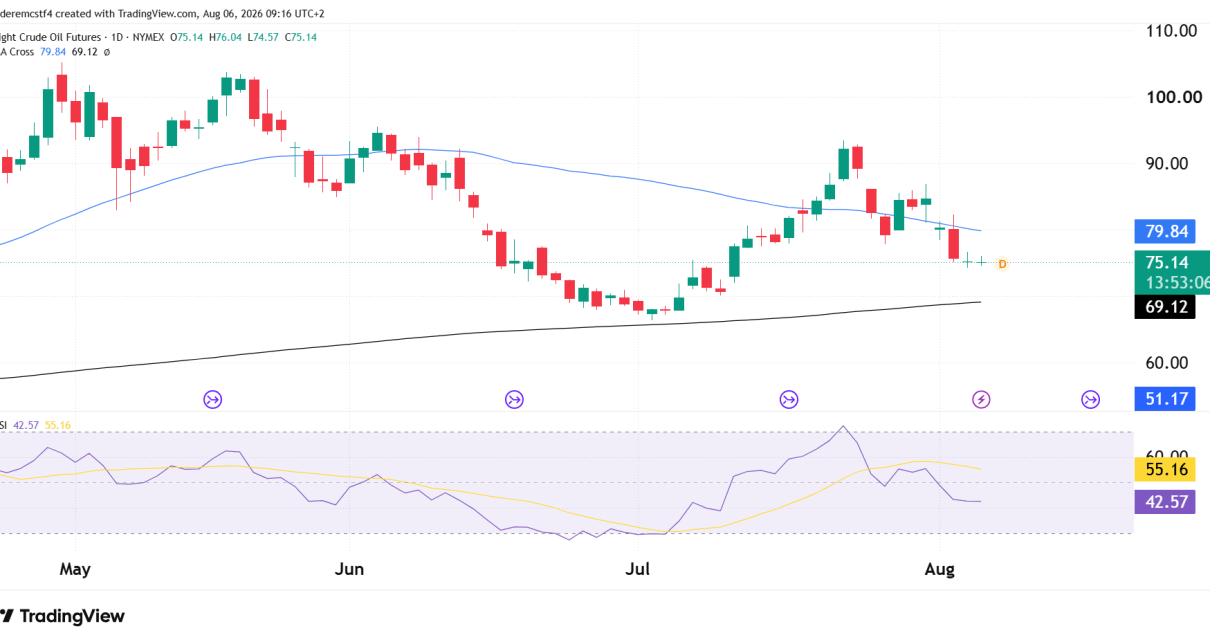
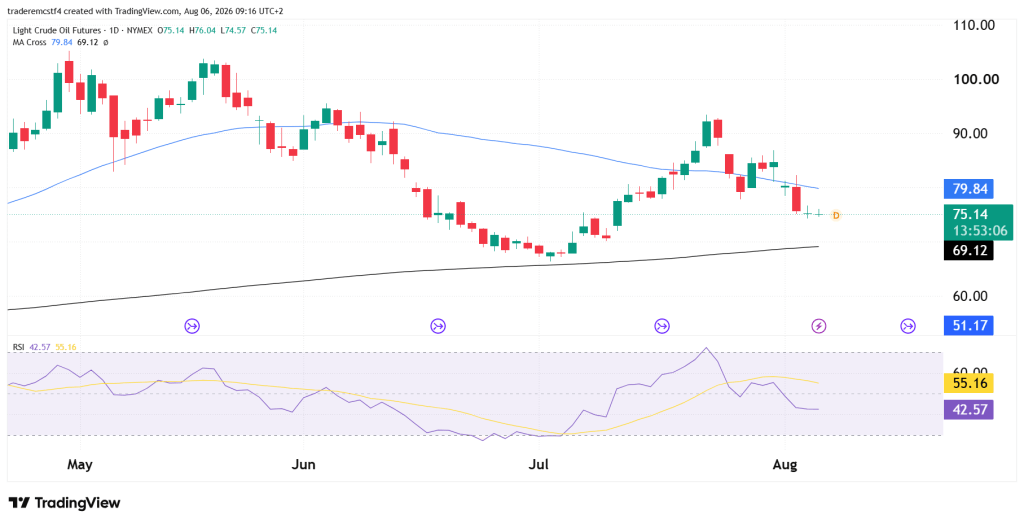
We flagged 79.92 as the level that needed to hold in our last analysis on crude, with a break opening the door to the 75.00–77.00 shelf. Oil fell hard into that zone, losing roughly 11% across the week’s first three sessions and closing at 75.22, right at the bottom of the range we’d been watching.
The question now is whether that shelf holds as support, or whether the same news driving this decline — real progress toward reopening the Strait of Hormuz — has enough weight behind it to push price straight through toward the 68–69 zone.
The Strait of Hormuz Deal, in Context
A few points worth flagging:
- The decline is headline-driven, not a technical breakdown in isolation. Iran and Oman reportedly reached an agreement on a proposed shipping route through the Strait, raising the prospect of energy flows resuming through the waterway that had been a major source of the supply-risk premium baked into prices since the spring.
- The move has been fast and one-directional. WTI lost around 11% across three sessions this week alone — the kind of drop that typically overshoots before finding real buyers, even within a genuine trend change.
- The EIA’s outlook already assumes de-escalation. The agency has been building an expectation that shut-in production returns to near pre-conflict levels by year-end, which means some of this repricing reflects the market catching up to that view rather than pure panic selling.
- Nothing here is finalized yet. Reports note the joint statement between Iran and Oman is still under review, and the deal depends on third parties not obstructing the process — this remains a headline that could still swing either way.
The bigger picture: this is a supply-risk premium unwinding, not new demand weakness. That distinction matters for how sustainable the move lower actually is.
Key Support and Resistance Levels
Major Resistance
| Level | Notes |
|---|---|
| 77.00 | Top of the shelf that just gave way; first level to reclaim on any bounce |
| 79.85 | Faster moving average |
| 82.00 | Prior support, now a deeper resistance level |
Major Support
| Level | Notes |
|---|---|
| 74.57 | Session low |
| 73.00 | Round-number support, first target if the shelf fails to hold |
| 69.12 | Slower moving average — the major trend-defining level below |
Possible Trades
Bounce / shelf holds
- Entry trigger: daily close back above 77.00
- Stop: below 74.57
- Target: 79.85 initial, 82.00 extended
Continuation lower
- Entry trigger: daily close below 74.57
- Stop: above 77.00
- Target: 73.00 initial, 69.12 extended
Invalidation / range scenario
- Chop between roughly 74.50 and 77.00 without a decisive close either side should be read as the market digesting a fast, headline-driven move rather than confirming the next leg
- Given how quickly this decline has unfolded, a sharp snapback bounce wouldn’t be surprising even if the broader move is still down — size positions accordingly
Summary
Crude has fallen straight through the shelf we’d flagged as the first downside target, driven almost entirely by real progress on reopening the Strait of Hormuz rather than a shift in demand. That makes 74.57–77.00 the zone to watch closely: a hold here keeps this looking like a sharp but contained repricing of supply risk, while a clean break opens the door to a much deeper test of the 69 area.
Trading futures involves substantial risk of loss and is not suitable for all investors. Past performance is not indicative of future results. This analysis is for informational and educational purposes only and does not constitute financial advice. Nothing in this article should be construed as a recommendation to buy or sell any security or financial instrument. Always conduct your own due diligence and consult with a licensed financial advisor before making any trading decisions.

