- There is a minor support zone at $1,786 we are still monitoring closely
- Rising wedge, triple bottom, and bearish divergence are giving clearly defined targets
Recap From December 7th
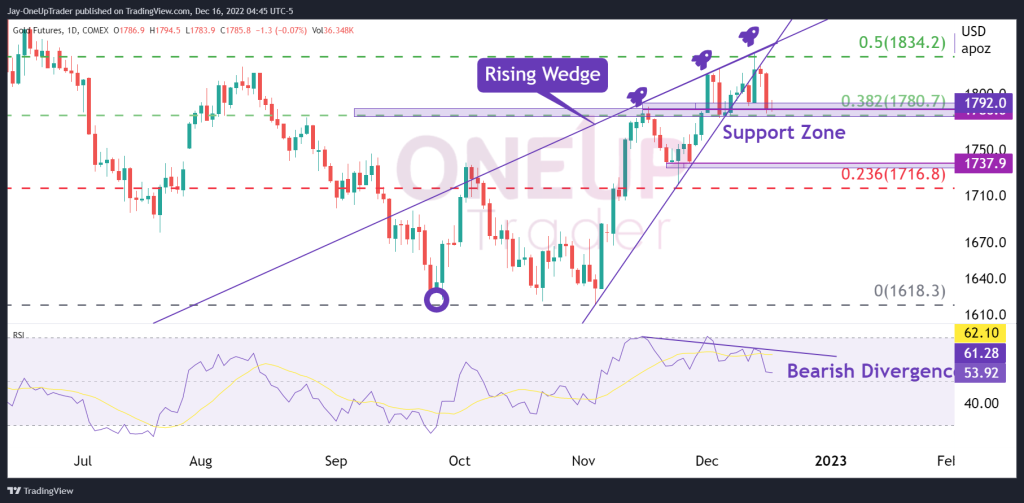
The minor support zone at $1,786 is back in play once we mentioned GC may bounce out of it from our analysis on December 7th. Gold was trading right within the zone and we suspected a potential bounce was imminent. GC rallied out of the zone toward the 50% Fib retracement at $1,834.2 and has now dipped back into the support zone at $1,786.
What Our Analysis Tells Us
There are a few worrying signs for Bears as we notice bearish divergence on the RSI, a sell-off at the 50% Fib retracement, a lackluster higher high, and a rising wedge that has been broken to the downside. Let’s look at each individually.
Bearish Divergence
The Gold price made three consecutive higher highs on the daily chart with the first being on Tuesday, November 15th. I marked each off with a rocket ship. Each time these highs were made, the RSI failed to print new highs which is not a problem if a consolidation period occurs in price terms. There has been no consolidation, however, and the RSI has been falling. This indicates to us that the buy pressure is dwindling.
Since GC is trading within the support zone mentioned above there is the option to go long, however, I feel that is only a trade if we see a consolidation phase first around the support zone. A bounce from here is less likely due to the divergence. Probabilities point toward a consolidation period or a sell-off from here has a higher chance than a move higher.
Sell-Off At 50% Retracement & Weak Higher High
The 50% level is generally a good target to go for as it clearly marks 50% of the prior move’s price action. This could have been the reason we saw such a lackluster impulse move with the price only breaking through the previous high by a few points. The fact that we saw a sharp sell-off at the moment price touched that level ($1,834.2) is an indication that there is still a fair amount of sellers that want to short Gold.
Rising Wedge
As I mentioned in the last article, the rising wedge is not an immediate sign that the price is going to reverse. We know that if a break does occur it can lead to a consolidation phase before a new leg up, or in the msot bearish case, a drop right back down to where the wedge first started.
Targets To Aim For
Bears will be targetting the 0.236 level or slightly higher in a zone between $1.716.8 and $1,737.9. If the minor support zone does result in a consolidation phase and price ends up breaking below, this would be the most immediate target for bears. The unlikely chance of a bounce from this level would lead to targets of $1,834.2 which is the Fib 50% level once again.