

Introduction
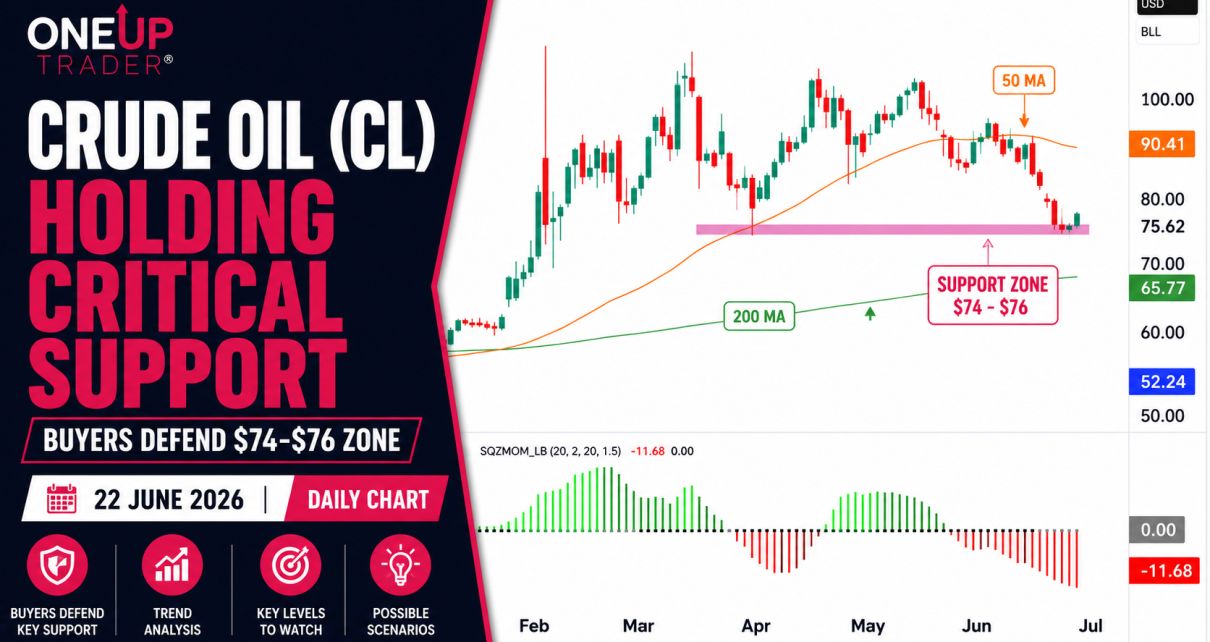
Since our June 16 analysis, crude oil has done exactly what we suggested was the most likely outcome. Rather than immediately breaking lower toward $70, buyers stepped in at the $74-$76 support zone and managed to stabilize price.
This support area was the last major level we highlighted before the 200-day moving average near $66. While it is still too early to call this a full reversal, bulls have at least prevented the correction from accelerating further.
The question now is whether the bulls are going to be able to push this market back up to test the 50-day MA, or the bears step in on this green candle and sell it below the support. If we did see it fall below this support level, then it would mean the market would wipe out nearly 40% of the rally we saw from the beginning of March.
CL Futures Trend Analysis
Momentum Is Still Weak
One of the themes from our previous report was that the decline was occurring through a lack of buying interest rather than aggressive panic selling.
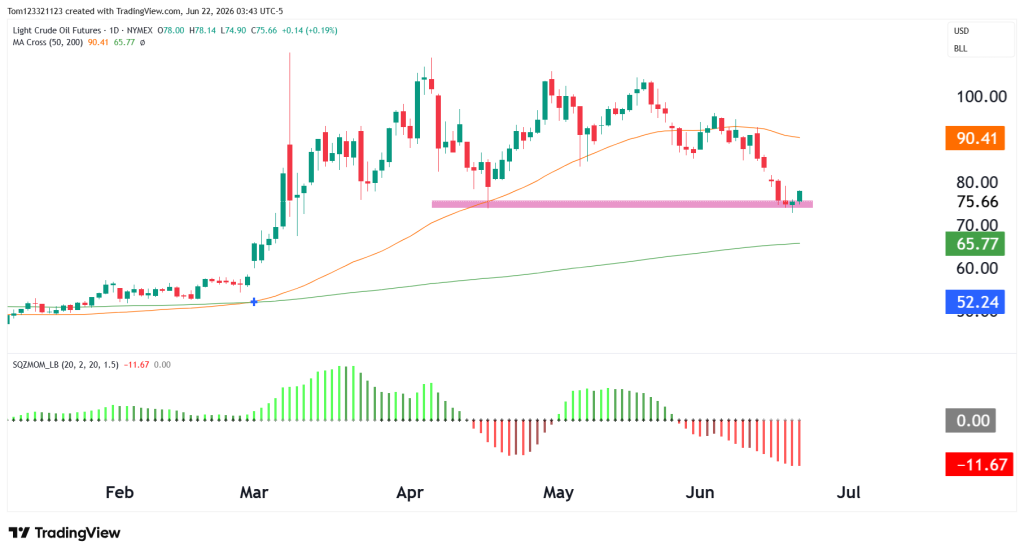
The squeeze momentum indicator continues pushing deeper into negative territory, showing that momentum has not yet turned bullish despite the support reaction. What has changed is that downside momentum appears to be slowing as price approaches support.
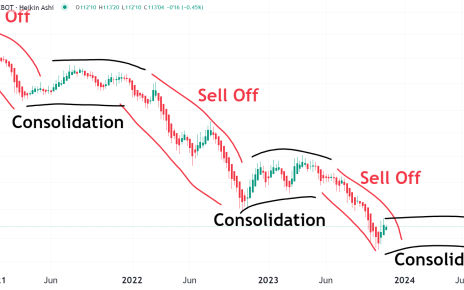
This creates a fairly common setup where markets transition from a strong trend move into a consolidation phase before deciding on the next directional move.
For bulls, simply holding support is not enough anymore. The next step is creating higher highs and reclaiming levels above $80. They also need to see a step up in volume.
Until that happens, any bounce remains mainly a countertrend move.
Estimated Probabilities for CL Futures
| Scenario | Estimated Probability | Market Interpretation |
|---|---|---|
| Consolidation between $74 and $80 | 50% | Market stabilizes and absorbs the recent decline |
| Breakdown toward $70 | 30% | Support fails and sellers regain momentum |
| Recovery back toward $85 | 20% | Buyers successfully build a larger bounce from support |
Key Support and Resistance Levels
Major Resistance Levels
- $80
- $85
- $90.41 (50-day moving average)
Major Support Levels
- $74-$76 support zone
- $70
- $65.77 (200-day moving average)
CL Possible Trades
Support Bounce Trade
This remains the most interesting setup on the chart. Buyers have already shown a willingness to defend the $74-$76 area. If price continues holding above support and begins forming higher lows, a recovery toward $80-$85 becomes increasingly realistic.
Consolidation Trade Setup
At the moment, this appears to be the highest probability scenario. Momentum is weak, but support is holding.
Bearish Continuation Trade
The bearish case remains valid while crude oil trades below the 50-day moving average. If support finally breaks, there is very little technical structure beneath current prices until the $70 region.
This analysis is provided for educational and informational purposes only and should not be considered financial or trading advice. Trading futures, forex, and other leveraged financial instruments carries a high level of risk and may not be suitable for all investors. Past performance is not indicative of future results. Before making any trading decisions, conduct your own research, assess your risk tolerance, and consult with a qualified financial advisor if necessary.