

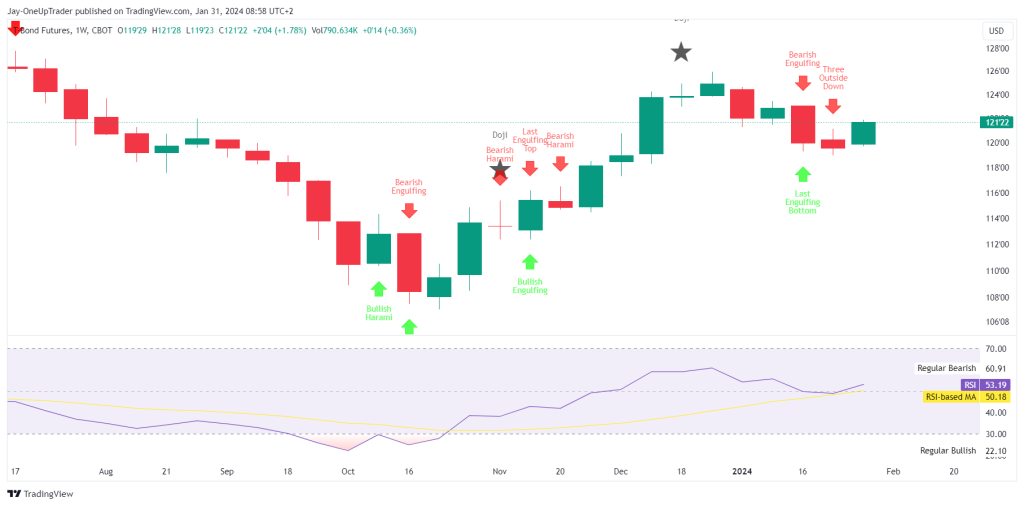
Weekly Chart
On the weekly chart, bond buying is evident as the yields have continued to decrease since 2020. The RSI has moved above the neutral zone and is sitting at 53.19. The weekly does not give much clues about where we could see it moving in the near term and is neutral.
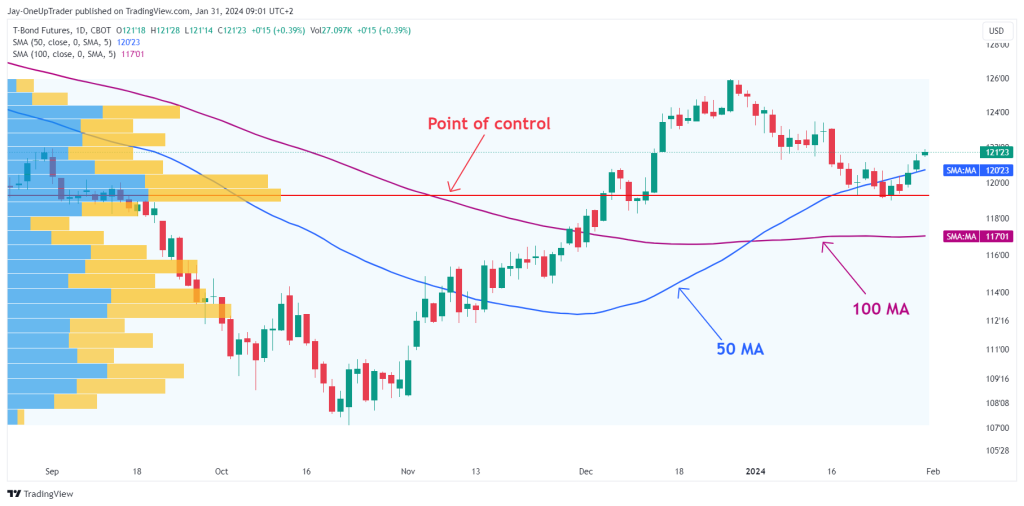
Daily Chart
Switching to the daily chart, T-Bond Futures have recently crossed above the 50-day Simple Moving Average (SMA). The price is also above the 100-day SMA, reinforcing the bullish outlook in the short term. Moreover, the Point of Control from the volume profile indicates a significant level of traded volume at current prices, which has acted as a support zone a few weeks ago and may continue to do so if price retraces to test it again.
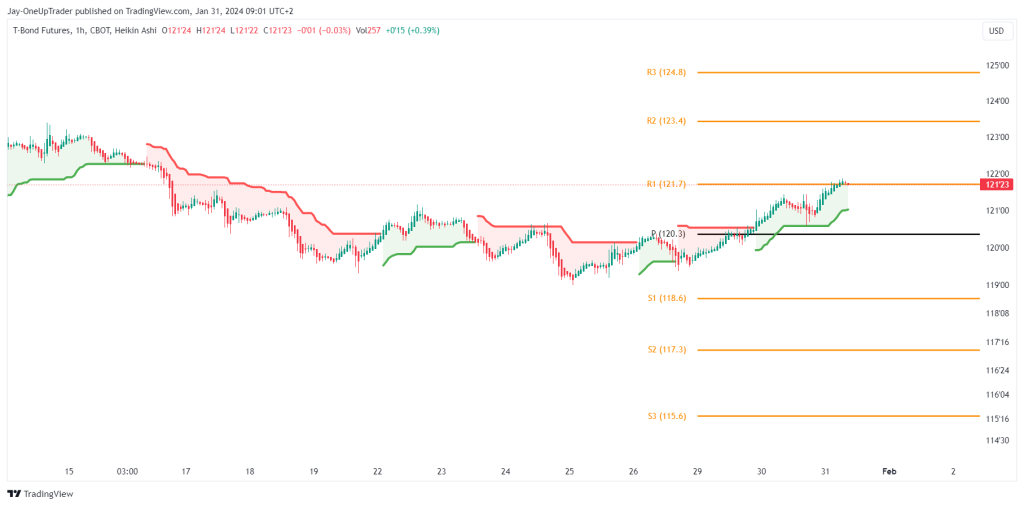
Hourly Chart
Currently, the chart shows a green trend with the Supertrend indicator also signaling bullish price action. The price is hovering around the R1 pivot point at 121.7, if we see price break above this level, a long trade could be placed targeting R2 at 123.4 with a stop placed below the pivot point.
Key Levels to Watch:
- Support: We should monitor the 50-day SMA at 120.23 on the daily chart as the nearest support level. A break below this could shift the short-term outlook to bearish.
- Resistance: On the hourly chart, the R1 pivot point at 121.7 is the immediate resistance. If the bulls are strong enough, we could see this price level break, aiming for R2 at 123.4 and R3 at 124.8.
Potential Trades:
- Bullish Scenario: If you are looking to take a long position, consider entering above the 121.7 level with a stop loss just below it or even below the pivot point. The next targets could be the R2 and R3 pivot points as mentioned above.
- Bearish Scenario: A break below the 50-day SMA at 120.23 could be used as a trigger for a short position with a stop loss placed above this SMA to limit risk.
The current rating is cautiously bullish based on the daily chart’s SMA positioning and the hourly chart’s Heikin Ashi and pivot points analysis. However, given the bearish engulfing pattern on the weekly chart, it is important to be vigilant for any signs of weakness or reversal.

