

Introduction
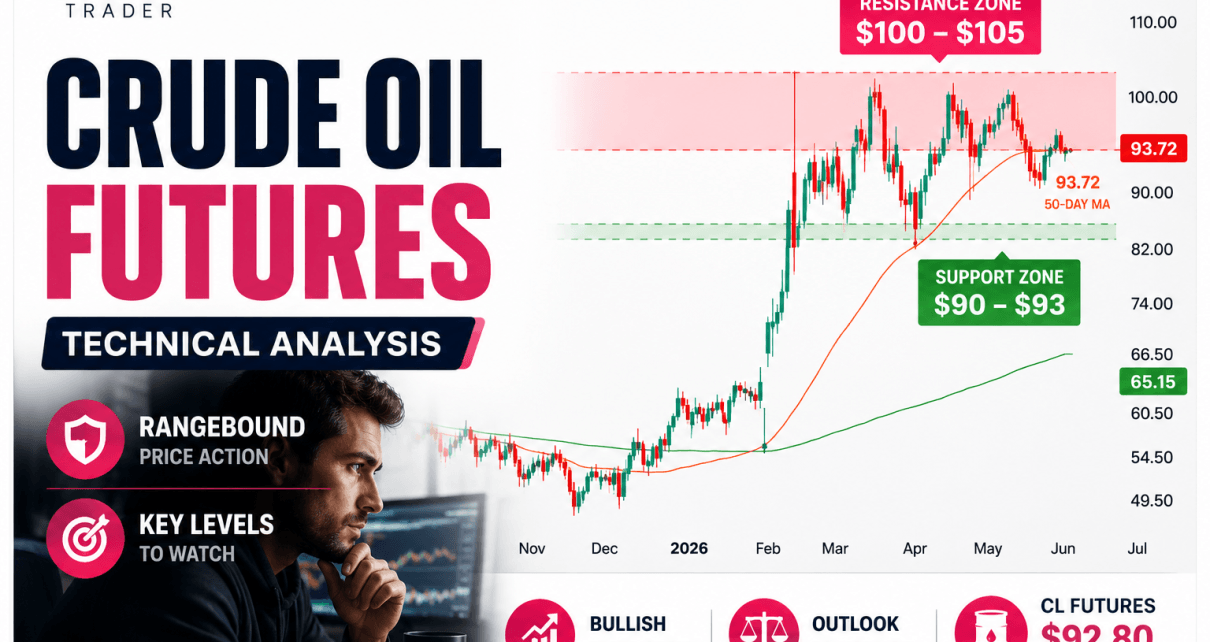
In our previous analysis, we highlighted the $100–$105 region as the key battleground for crude oil futures. We also noted that progress in US-Iran negotiations could continue, removing some of the risk premium that had fueled the rally throughout March and April, and since then, that is mostly what has happened.
CL has remained trapped below the $100–$105 zone but the strong point for the bulls now is the 50 day moving average. It is holding as support, and as long as it continues, then even though CL is consolidating, the stronger side looks to be with the bulls. Now is a good test because the price is sitting on it as we speak.
Lets take a closer look at the technicals and what they are telling us.

CL Futures Trend Analysis
Estimated Probabilities for Crude Oil Futures
| Scenario | Estimated Probability | Market Interpretation |
|---|---|---|
| Continued consolidation between $90 and $105 | 50% | Market remains range-bound while waiting for a catalyst |
| Bullish breakout above $105 | 30% | Buyers regain momentum and resume the uptrend |
| Breakdown below $90 support | 20% | Sellers gain control and trigger a deeper correction |
Key Support and Resistance Levels
Major Resistance Levels
- $100
- $105
- $110
Major Support Levels
- $90–$93
- $85
- $65.15 (200-day moving average)
CL Possible Trades
Range Trading Setup
The highest-probability right now remains consolidation. Crude oil has spent several weeks respecting both support and resistance, and traders will likely continue monitoring reactions at both ends of the range until a breakout occurs.
Bullish Continuation Trade
The longer-term trend remains bullish while price continues holding above the 50-day moving average. A breakout above the $100–$105 resistance zone would signal that buyers are regaining control and could open the door for another move toward the $110 area.
Bearish Breakdown Trade
The bearish case becomes more compelling if crude loses the $90 support zone and begins closing below the 50-day moving average consistently. In that scenario, traders may begin looking for a larger retracement toward the $85 region.
Ready to put your analysis into action? Start your evaluation with OneUp Trader and save 10% using code:
This analysis is provided for educational and informational purposes only and should not be considered financial or trading advice. Trading futures, forex, and other leveraged financial instruments carries a high level of risk and may not be suitable for all investors. Past performance is not indicative of future results. Before making any trading decisions, conduct your own research, assess your risk tolerance, and consult with a qualified financial advisor if necessary.
