

Introduction
Gold futures have responded exactly where traders expected a reaction following our previous analysis. There, we looked at how important the 4,400–4,420 support zone was as well as the rising trendline from the April swing low. Since then, buyers have successfully defended that area and pushed Gold back above 4,550.
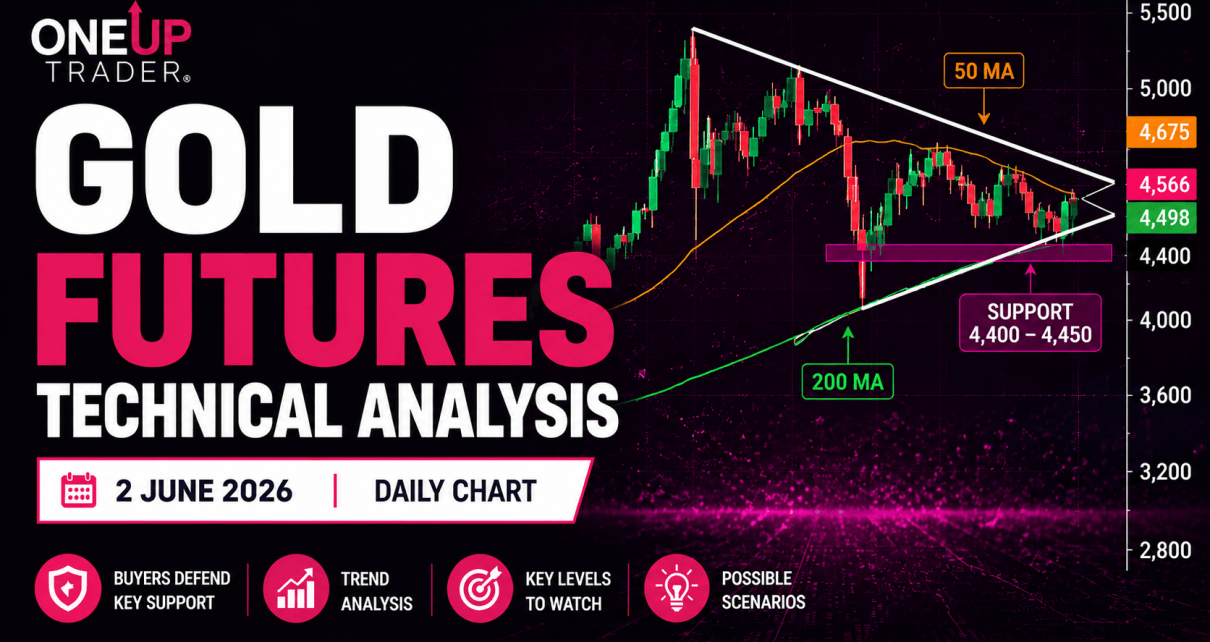
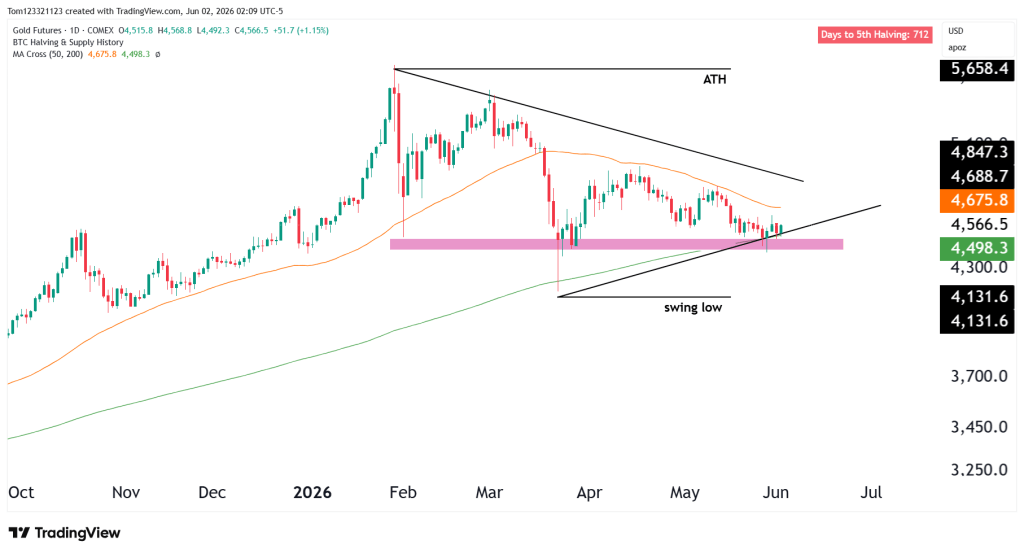
The daily chart now shows Gold futures trading around 4,566 after bouncing from support while continuing to sit between a rising support trendline and a descending resistance trendline. This consolidation has formed a big symmetrical triangle, which will play an important role in how the next break will occur because price is coiling up like a spring.
The overall trend is still bullish, but bulls will have to fight here to keep the price above this zone.
Gold Futures Trend Analysis
Current technicals show:
- The 50-day moving average near 4,675
- The 200-day moving average near 4,498
- Current price trading around 4,566
- Major resistance zone near 4,675–4,850
- Key support zone near 4,400–4,450
Buyers Defend Support, But Resistance Remains
The recent bounce is encouraging for bulls because it shows buyers are still strong.
For now, a good sign would be to see price move above the 50 day moving average. This will give more strength to the bull case and we could see price then move to the upper resistance line of the triangle.
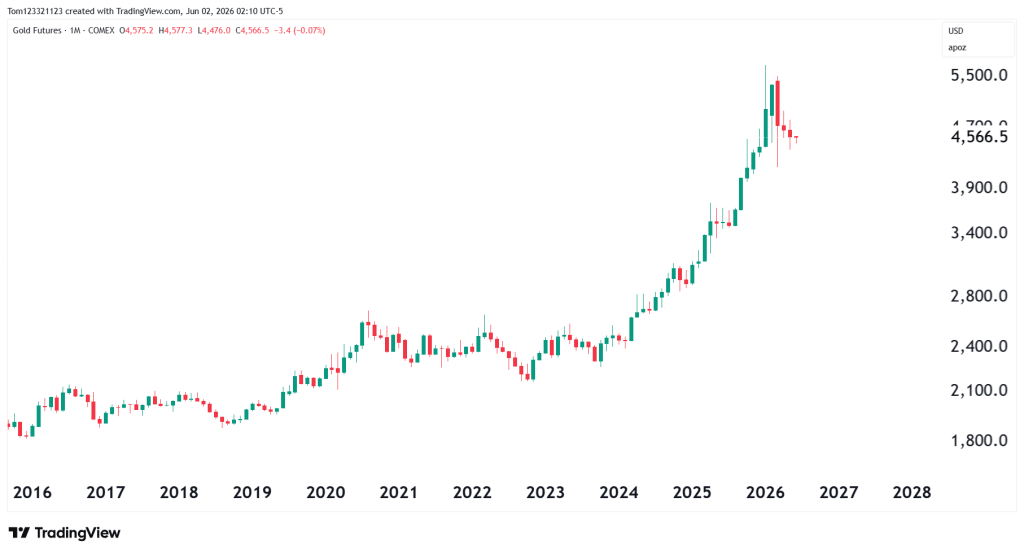
Monthly chart shows how strong the uptrend was starting back from 2023. After the first big red candle from March, the candles from April and May are smaller and have the look of a spinning top. This is telling us that the selling pressure is weakening and could be the turning point now for another bullish push.
Estimated Probabilities for Gold Futures
| Scenario | Estimated Probability | Market Interpretation |
|---|---|---|
| Consolidation between support and resistance continues | 40% | Market remains range-bound while building energy |
| Breakout above trendline toward 4,850 | 35% | Buyers regain momentum and challenge resistance |
| Breakdown below 4,400 support | 25% | Sellers regain control and extend the correction |
Key Support and Resistance Levels
Major Resistance Levels
- 4,675 (50-day moving average)
- 4,850
- 5,000
Major Support Levels
- 4,400–4,450
- 4,130 swing low
- 3,500–3,600 longer-term demand zone
Gold Futures Possible Trades
Bullish Breakout Trade
The most bullish scenario would involve Gold reclaiming the 50-day moving average and breaking above the descending trendline resistance. A successful breakout could shift momentum back in favor of buyers and potentially open the door for a move toward the 4,850 region.
Support Bounce Trade Setup
The support zone continues to hold. As long as buyers remain active above 4,400, traders will continue watching for higher lows and bullish reactions that support the broader recovery attempt.
Bearish Breakdown Trade
While buyers have successfully defended support so far, the market has not completely escaped danger. A decisive break below the 4,400 support zone would invalidate much of the recent recovery and could expose Gold to a larger move toward the April swing low near 4,130.
What Could Move Gold Next?
Several macroeconomic factors could influence Gold’s next move in the coming weeks:
- Federal Reserve interest rate expectations
- U.S. Dollar strength or weakness
- Inflation data
- Geopolitical uncertainty
- Central bank gold purchases
As long as uncertainty remains elevated and inflation concerns persist, Gold may continue finding support on larger pullbacks. However, traders should remain focused on the current triangle structure, which is approaching a potential breakout point.
Start Your Evaluation With OneUp Trader Today
Let us know your thoughts in the comment section below.
This analysis is provided for educational and informational purposes only and should not be considered financial or trading advice. Trading futures, forex, and other leveraged financial instruments carries a high level of risk and may not be suitable for all investors. Past performance is not indicative of future results. Before making any trading decisions, conduct your own research, assess your risk tolerance, and consult with a qualified financial advisor if necessary.
