


Introduction
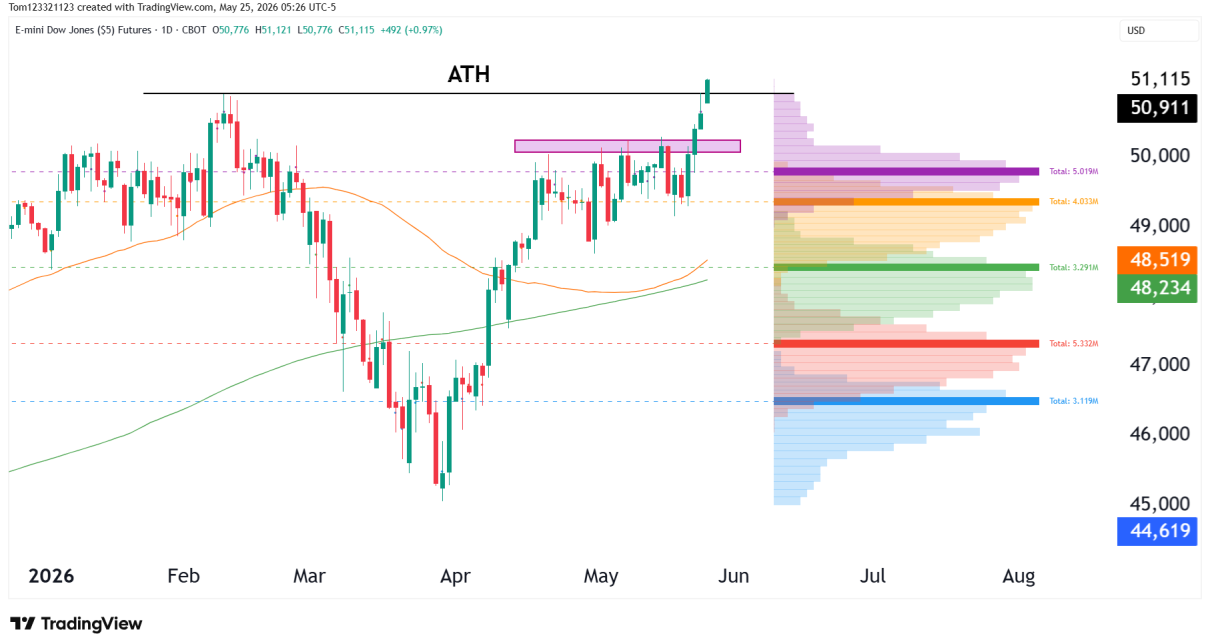
Dow Jones futures have now broken above the previous all-time high near 50,900, confirming the bullish breakout setup we looked at in our previous analysis. Following several weeks of a consolidation period buyers finally pushed YM into new highs heading into the final week of May.
While the Dow lagged behind Nasdaq during April and May, YM has quietly continued grinding higher and is now entering price discovery above previous highs.
Dow Jones Futures Trend Analysis
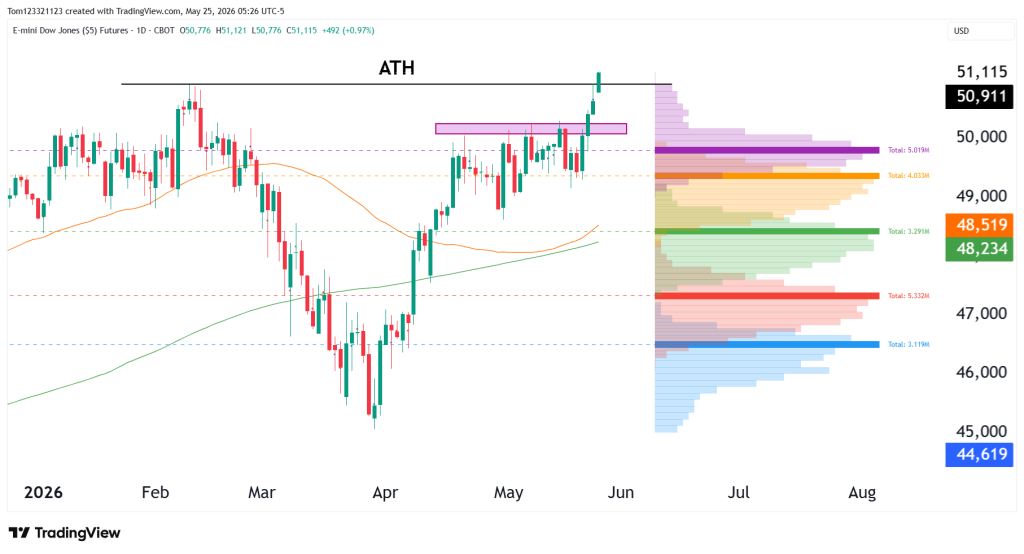
YM continues showing one of the cleanest bullish structures among the major US indices right now. After recovering nearly 6,000 points from the April lows, price has now reclaimed the previous ATH resistance and is attempting to hold above it.
Current technicals show:
- The 50-day moving average near 48,519
- The 200-day moving average near 48,234
- Current price trading around 51,115
- Previous ATH resistance near 50,900 now acting as support
One of the most important technicals on the chart is the breakout above the consolidation range that formed throughout most of May. Buyers repeatedly defended the 49,500 region before finally squeezing price through resistance.
The volume profile also shows relatively thin volume above the ATH zone, which could allow price to move faster now that resistance has been cleared.
Volume Profile and Key Market Levels
The largest volume cluster on the chart currently sits near the 49,700–50,000 region. This area now becomes an important support zone if YM begins pulling back after the breakout.
Meanwhile, the breakout above 50,900 puts YM into price discovery mode. If momentum continues building, buyers could continue pushing price aggressively higher into the start of June.
Estimated Probabilities for Dow Jones Futures
| Scenario | Estimated Probability | Market Interpretation |
|---|---|---|
| Continued breakout toward 52,000 | 55% | Buyers maintain momentum above ATH support |
| Consolidation above 50,900 | 30% | YM pauses after breakout while maintaining bullish structure |
| Failed breakout back below ATH | 15% | Sellers reject new highs and trigger pullback |
Key Support and Resistance Levels
Major Resistance Levels
- 51,500
- 52,000
- 53,000
Major Support Levels
- 50,900 previous ATH
- 50,000 psychological support
- 48,519 (50-day moving average)
YM Possible Trades
Bullish Continuation Trade
As long as YM continues holding above the previous all-time high, momentum remains firmly with the bulls. A successful retest of the breakout zone near 50,900 could strengthen the current move further and potentially open the door toward the 52,000 region if buyers continue stepping in aggressively during shallow pullbacks.
Pullback Trade Setup
Even after the breakout, pullbacks into previous resistance may continue offering opportunities if buyers maintain control above support. Higher low formations, bullish rejection candles near 50,900, and continued strength above the moving averages would all support the broader bullish structure remaining intact.
Failed Breakout Scenario
If YM loses acceptance above the previous ATH and falls back below 50,900, we could see momentum slow significantly in the short term. A failed breakout could trigger profit-taking and lead to a deeper retracement back toward the high-volume support zones near 50,000 and the 50-day moving average.
This analysis is provided for educational and informational purposes only and should not be considered financial or trading advice. Trading futures, forex, and other leveraged financial instruments carries a high level of risk and may not be suitable for all investors. Past performance is not indicative of future results. Before making any trading decisions, conduct your own research, assess your risk tolerance, and consult with a qualified financial advisor if necessary.

