

Introduction
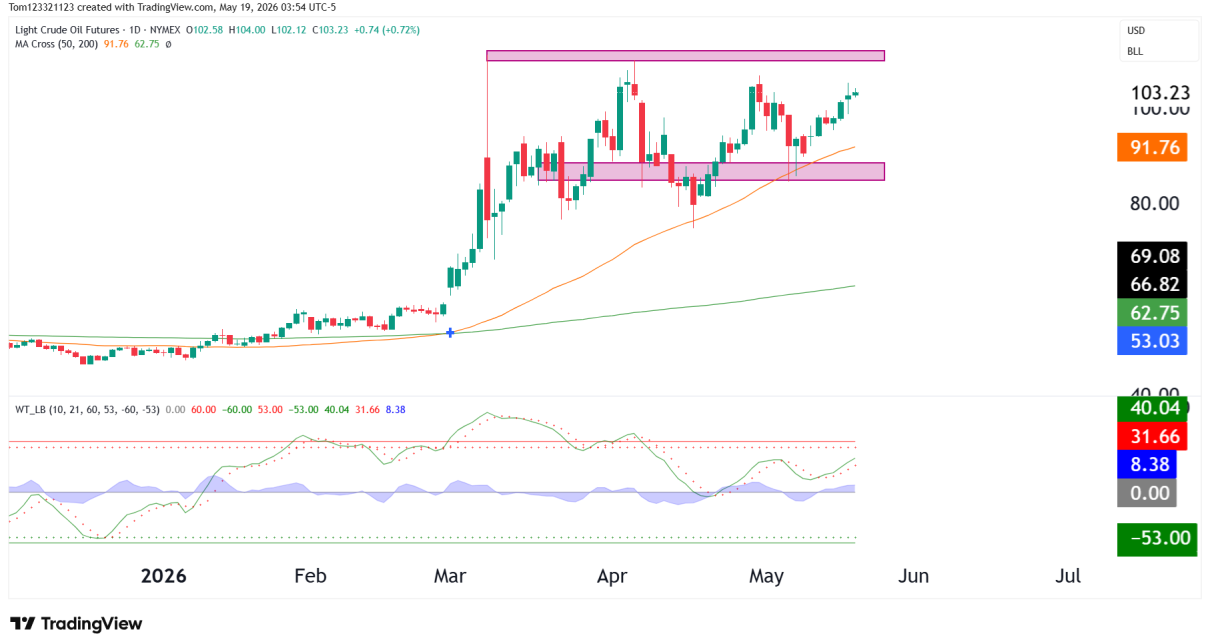
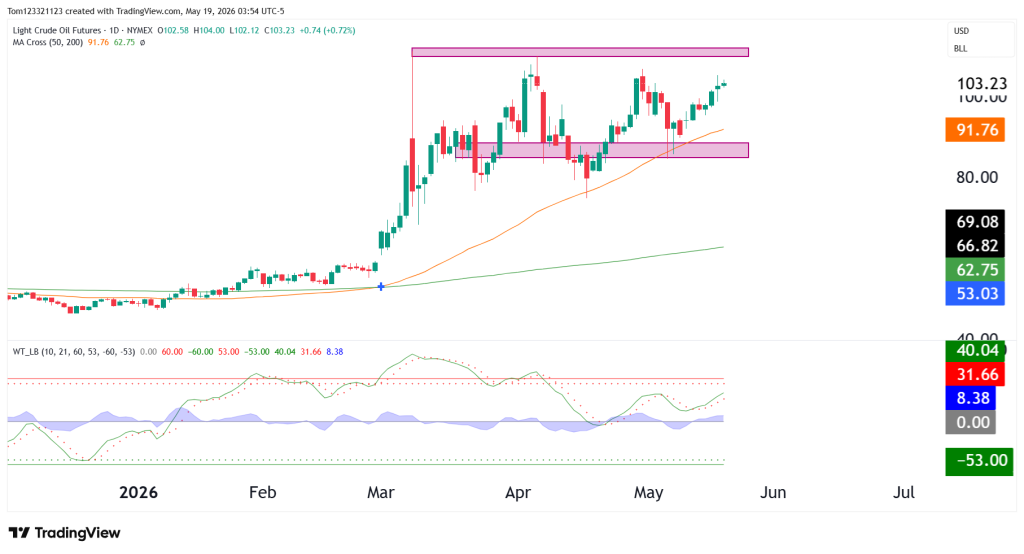
WTI crude oil futures continue showing strong bullish momentum as prices push back toward major resistance near the $104 region. After a sharp breakout during March due to the escalation in the middle east, bulls have remained in full control.
The current daily chart structure shows bullish momentum as crude oil futures continue trading well above both the 50-day and 200-day moving averages. Pirces are also nearing the high made back in March of $111.02. With geopolitical tensions, demand expectations, and supply-side uncertainty continuing to influence oil prices, traders are closely monitoring whether WTI can successfully break above resistance and extend the rally.
WTI Crude Oil Trend Analysis
Current technical structure shows:
- The 50-day moving average near 91.76
- The 200-day moving average near 62.75
- Current price trading around 103.25
- Strong bullish price structure with higher lows
One of the most important technical areas on the chart is the resistance zone between $104 and $106. Crude oil futures have tested this region multiple times over the past several months but have not yet broken out.
If buyers successfully break above the current resistance zone, crude would move into price discovery mode again as there are no more immediate reesistance levels above the previous high.
Estimated Probabilities for Crude Oil Futures
| Scenario | Estimated Probability | Market Interpretation |
|---|---|---|
| Bullish breakout above $104 | 50% | Buyers maintain momentum and push through major resistance |
| Continued consolidation between $96 and $104 | 35% | Crude oil pauses while maintaining overall bullish structure |
| Bearish rejection toward $91 support | 15% | Sellers defend resistance and trigger deeper pullback |
Key Support and Resistance Levels
Major Resistance Levels
- $104.00–$106.00
- $110.00
- $115.00
Major Support Levels
- $96.00
- $91.76 (50-day moving average)
- $85.00
These zones may become increasingly important as energy traders react to inventory data, OPEC developments, geopolitical headlines, and changes in global demand expectations.
Possible Trades
Bullish Breakout Trade
Possible buying opportunities:
- Strong daily close above $104
- Increased bullish momentum on breakout volume
- Successful retest of broken resistance as support
Trend Continuation Pullback Trade
As long as crude oil remains above the 50-day moving average, traders could continue watching for pullback opportunities within the existing uptrend.
Possible signals include:
- Bullish rejection candles near support
- Higher low formations
- Momentum recovery after shallow pullbacks
- Support holds near the moving average cluster
Bearish Rejection Trade
Although the primary trend remains bullish, traders could also monitor for signs of exhaustion near resistance.
Potential bearish signals may include:
- Multiple failed breakouts above $104
- Large bearish reversal candles
- Momentum divergence
- Breakdown below the 50-day moving average
This analysis is provided for educational and informational purposes only and should not be considered financial or trading advice. Trading futures, forex, and other leveraged financial instruments carries a high level of risk and may not be suitable for all investors. Past performance is not indicative of future results. Before making any trading decisions, conduct your own research, assess your risk tolerance, and consult with a qualified financial advisor if necessary.

