

- Nasdaq responds to fears of a recession.
- ECB minutes helped the index to gain slightly.
- Federal Reserve remains on track to hike rates aggressively.
The fall of Nasdaq 100 index futures (NQ) continues amidst fears of a recession, bringing down US indices in Asian and European markets. At the time of writing, the index had fallen by 1.73%. This continued from yesterday and was mainly caused by significant losses made by major tech companies. Morgan Stanley has recently revised the probability of a recession from 5% to 27%.
These are dark days, and there might just be more gloomy days ahead. Some of the economic factors fueling this panic and collapse include rising inflation. Later today, we will be expecting ECB minutes shed more light on the likelihood of a July rate hike.
The Vice President of the European Central Bank, Luis Guindos, appeared at 12:30 GMT. US initial jobless claims rose to 218k against the expected 200k.
Elsewhere, Netflix (NASDAQ: NFLX), the streaming giant, will be the focus of most investors after they laid off about 150 employees; approximately 2% of the company’s workforce in the United States and Canada, due to slowing growth.
Investors also got an updated look at the housing market, with data for housing starts and building permits for April being released early Wednesday.
On Tuesday, US Federal Reserve chief Jerome Powell promised that the US central bank would lift interest rates as high as required to reduce the rise in inflation.
Earlier this month, the Fed raised interest rates by 50 basis points for the second time in 2022, and investors expect the central bank to hike by the same amount next month.
Nasdaq 100 index futures (NQ) technical analysis:
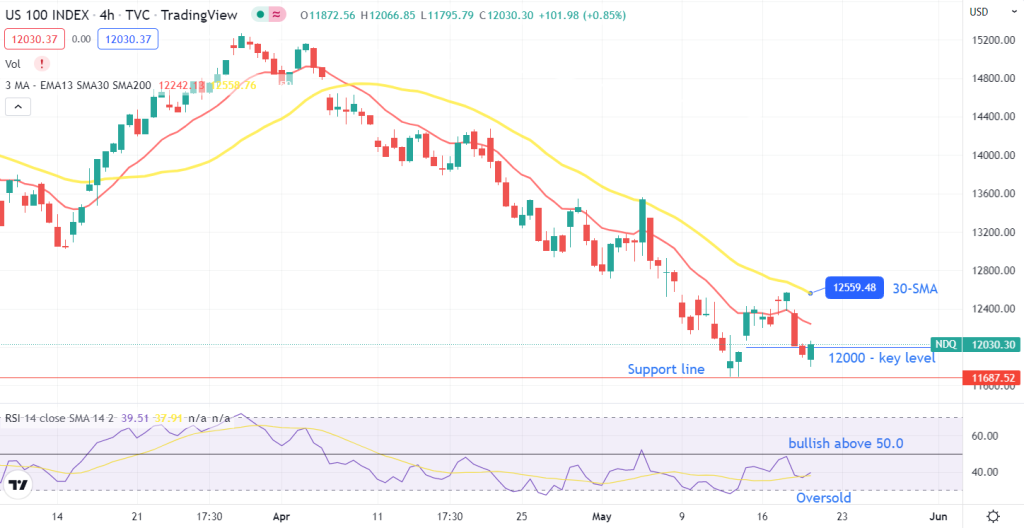
Looking at the 4-hour chart, the price is showing a clear downtrend. Prices are wobbling around the 12,000 area, which is a key level. Sustaining below this level could mean further losses.
The RSI also shows the oversold conditions. This indicates a well-established downtrend for this index. If the trend continues, the price may retest the support of 11,687. A reversal in this bias will only occur if the price breaks and stays above the 30-SMA and the RSI starts rising.