

Introduction
T-Bond futures remain under pressure heading into the second half of May as sellers continue defending major resistance levels on the daily chart. After multiple failed recovery attempts throughout the past several months, price action is once again weakening beneath the 50-day and 200-day moving averages.
T-Bond Futures Trend Analysis
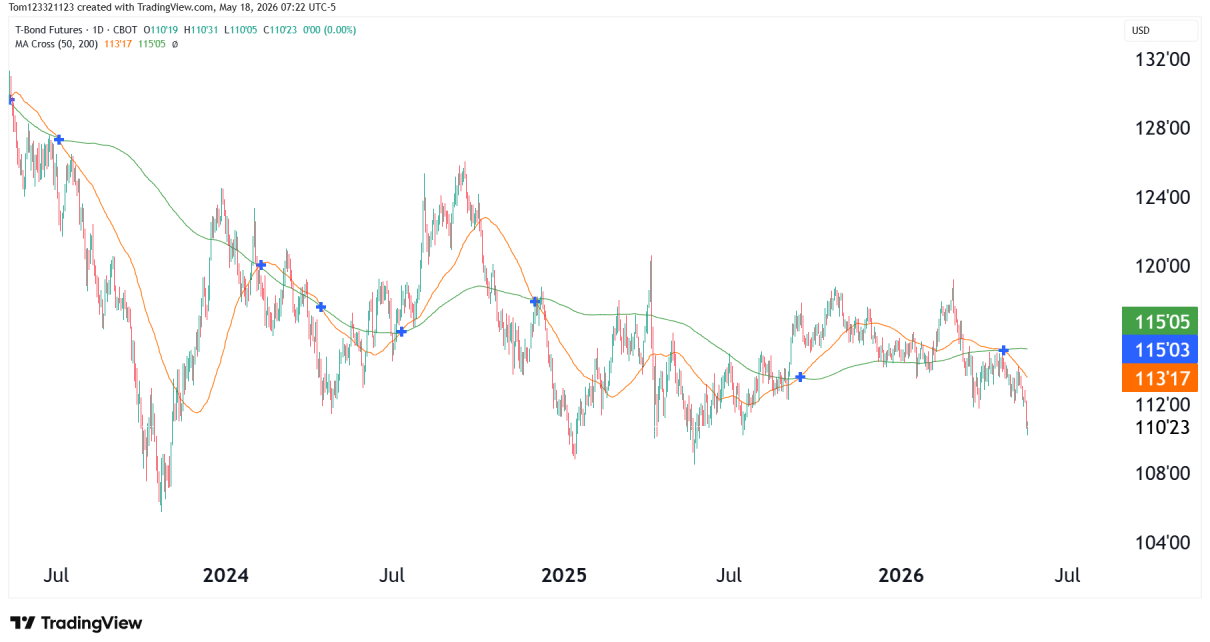
The trend in Treasury bond futures continues to lean bearish despite prolonged periods of consolidation. The current daily chart shows price trading below both the 50-day moving average and the 200-day moving average. In the current structure:
- The 50-day moving average sits near 113’17
- The 200-day moving average remains near 115’03–115’05
- Current price action has declined toward 110’23 support
Repeated rejection near these moving averages suggests buyers have struggled to regain long-term control. Until T-Bond futures reclaim these levels, bearish momentum may continue into the near future.
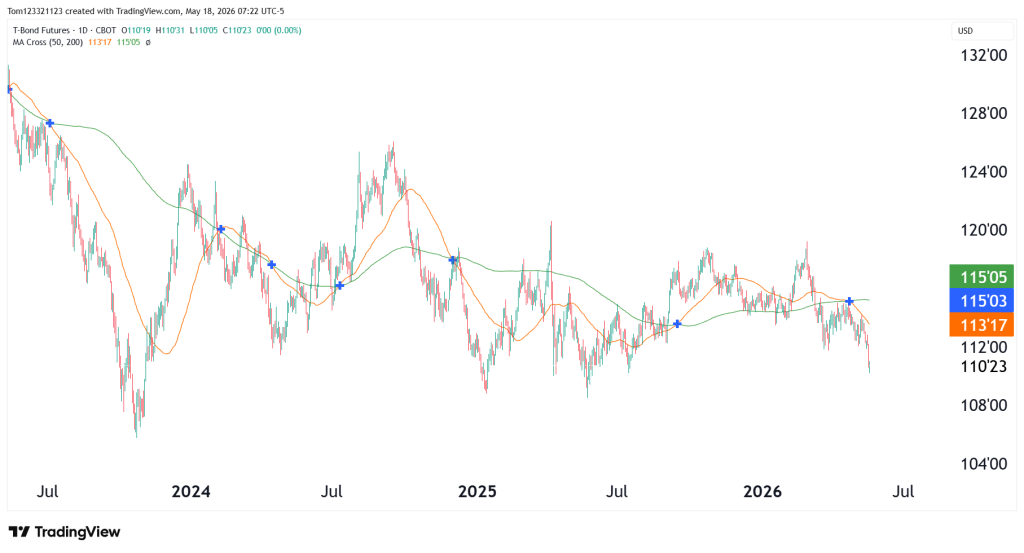
Treasury Futures Continue Forming Lower Highs
One of the most important technicals on the chart is the formation of lower highs since late 2024. Although the market has remained inside a wide range, each rally has shown weaker follow-through than the previous one.
This pattern tells us that there is fading bullish participation and increasing seller confidence, especially when combined with weakening momentum around key resistance zones.
Recent price action also reflects:
- Increased downside volatility
- Shorter recovery rallies
- Repeated failures near resistance
- Growing pressure on major support levels
If Treasury futures break below the 110’00 support region, traders may begin targeting deeper downside levels near 108’00 and potentially lower.
Estimated Probabilities for T-Bond Futures
While no technical analysis can guarantee market direction, traders often evaluate probability-based scenarios to prepare for multiple outcomes.
| Scenario | Estimated Probability | Market Interpretation |
|---|---|---|
| Continued decline toward 108’00 | 45% | Bearish trend structure remains intact beneath key moving averages |
| Sideways consolidation between 110’00 and 115’00 | 35% | Treasury futures continue ranging while markets await new economic catalysts |
| Bullish breakout above 115’05 | 20% | Buyers reclaim resistance and improve long-term momentum structure |
Key Support and Resistance Levels
Major Support Levels
- 110’00–110’23
- 108’00
- 106’00
Major Resistance Levels
- 113’17
- 115’03–115’05
- 118’00
These zones may become increasingly important as traders react to inflation reports, Treasury auctions, Federal Reserve commentary, and bond market volatility.
Possible Trades
Bearish Continuation Trade Setup
If price remains below both moving averages, we can continue monitoring bearish continuation opportunities.
Possible selling opportunities:
- Rejection candles near resistance
- Failed rallies beneath 115’00
- Increasing downside momentum below 110’23
- Strong bearish volume during selloffs
Range Trading Setup
Because the market has spent significant time consolidating, we could also continue looking for range-bound trades between major support and resistance:
- Buying near support exhaustion
- Selling near resistance rejection
- Short-term momentum reversals inside the broader range
However, range conditions can remain highly volatile and difficult to trade consistently due to sudden reversals.
Bullish Reversal Trade
For bullish momentum to improve meaningfully, buyers would need to:
- Reclaim the 200-day moving average
- Build higher highs and higher lows
- Sustain momentum above 115’05
- See supportive macroeconomic developments
If those conditions develop, Treasury futures could potentially rotate back toward prior highs near 118’00.
Federal Reserve Policy and Bond Market Volatility
Treasury futures remain heavily influenced by Federal Reserve expectations.
Higher yields pressure bond futures lower, while softer economic data or risk-off market behavior can support Treasury prices. As a result, upcoming economic releases may significantly impact short-term volatility and trend direction across the Treasury futures market.
Final Thoughts on T-Bond Futures
T-Bond futures continue showing signs of weakness as price trades beneath major moving averages and struggles to establish sustained bullish momentum. The current market structure favors cautious sentiment while sellers maintain control below resistance zones.
The 110’00 support region now becomes one of the most important levels to watch. A decisive breakdown could strengthen bearish continuation expectations, while a recovery above 115’05 would be needed to improve the broader technical outlook.
As Treasury markets continue reacting to Federal Reserve policy expectations and economic data, traders should remain focused on volatility, momentum shifts, and evolving interest rate dynamics in the sessions ahead.
This analysis is provided for educational and informational purposes only and should not be considered financial or trading advice. Trading futures, forex, and other leveraged financial instruments carries a high level of risk and may not be suitable for all investors. Past performance is not indicative of future results. Before making any trading decisions, conduct your own research, assess your risk tolerance, and consult with a qualified financial advisor if necessary.