- The E-mini Dow has been decorrelated from the overall market this month.
- The Daily chart shows overbought condition.
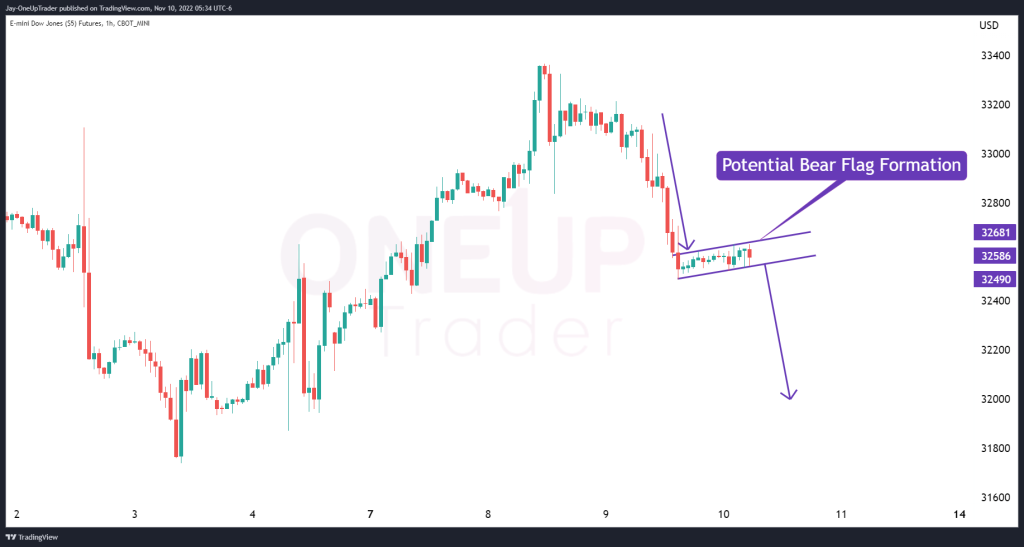
- A small bear flag pattern appears on the Hourly chart.
The Dow’s Decorrelation
The Dow Jones (YM) Futures has been completely decorrelated from markets for the past month. NQ has fallen by 1% this month, while YM has gained 11.2%. This shows investors’ interest in industrials at this time and the move to avoid riskier investments such as Tech.
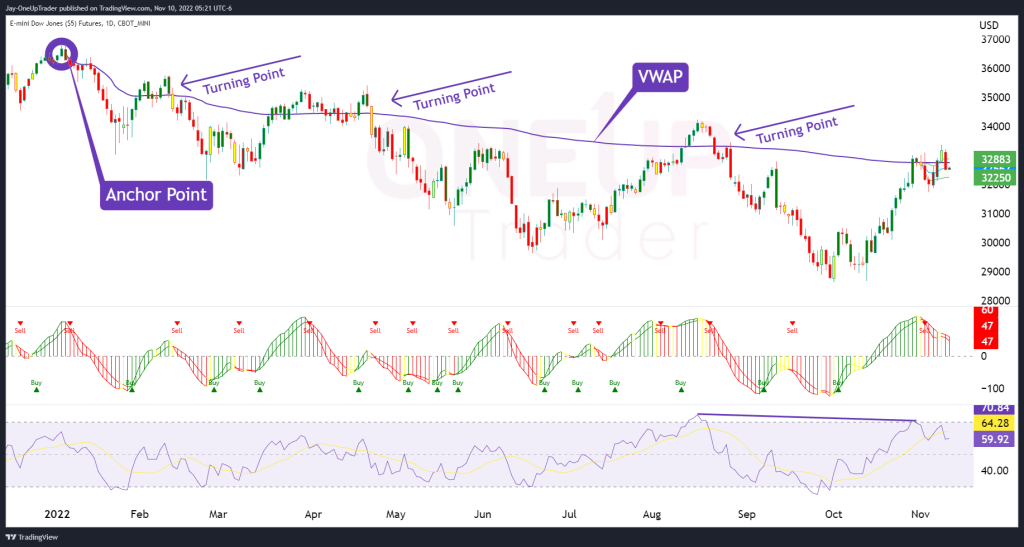
Daily Chart Appears Overbought
I have applied two indicators to the YM chart, an anchored VWAP and an overbought/oversold oscillator. The VWAP has been anchored to the high of the recent bull market. Since then, the VWAP has acted as a point of resistance, with the price turning lower each time it was tested. At the time of writing, YM is trading at the VWAP line, so the question arises if we could see it turn once more?
Overbought/Oversold Indicator
The overbought signs show on the chart as the Relative Strength Indicator (RSI) hovers around 59.89. The overbought/oversold indicator gives us a sell signal for the first time since September. If the RSI drops below the 50 line, it could signify that the rally is over. The overbought/oversold indicator can be found on tradingview.
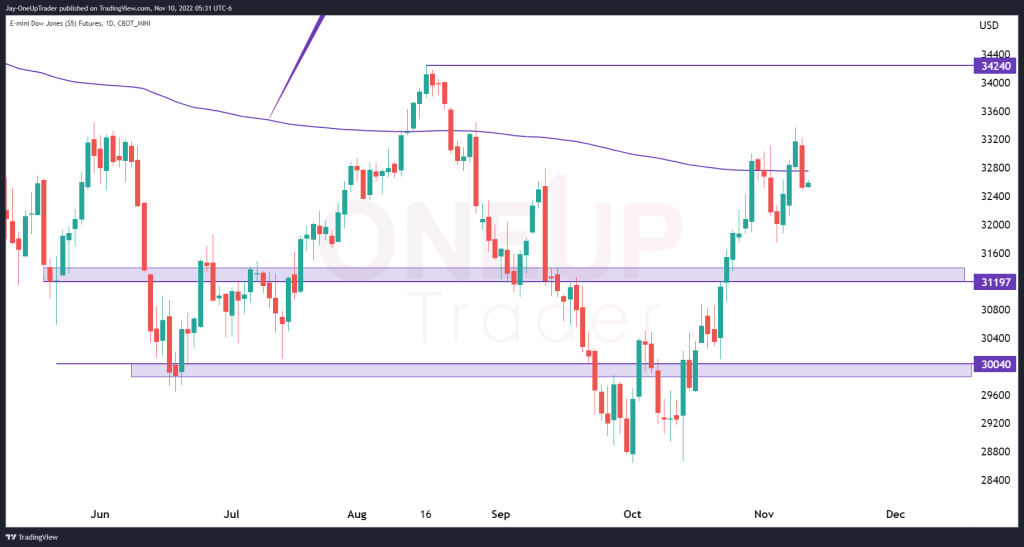
Price Targets If The Above Analysis Plays Out
There are two main zones moving downward that bears could target. The first is the liquidity zone at $31,197, and the second is at $30,040. Prices must remain below $34,240 for the bear case to remain a possibility. Any move higher than that would take out the previous macro lower high, which will be a good sign for bulls.
Potential Bear Flag On Hourly
A small bear flag pattern has been spotted on the hourly chart; although it has not competed yet, it should be something to keep an eye on as the CPI report comes out today.