


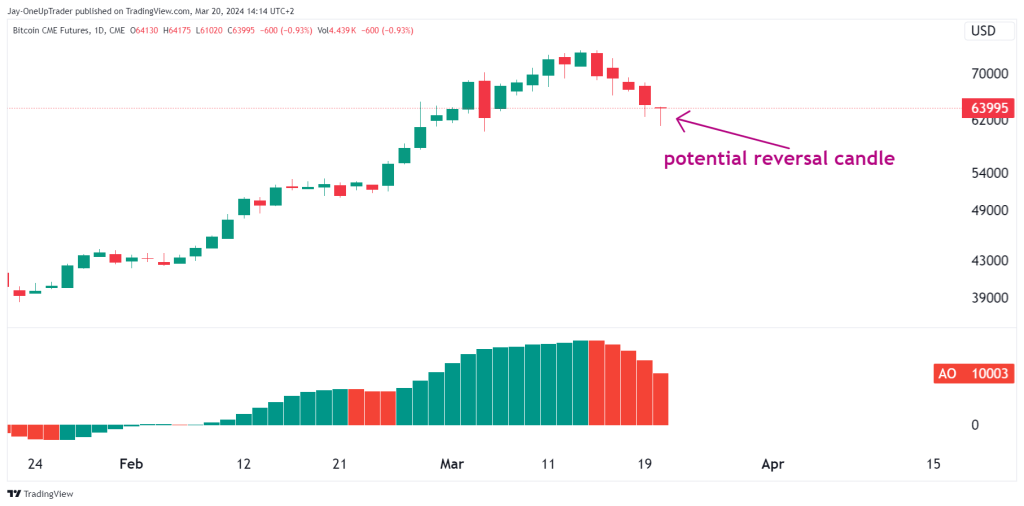
Daily Chart:
A potential reversal candle is forming after the recent downturn we have seen in Bitcoin. The Awesome Oscillator shows a decrease in momentum, highlighted by the shrinking green bars turning red. BTC has been on a tear, up over 50% for the year. A pullback was going to come eventually but the question is if this is the low?
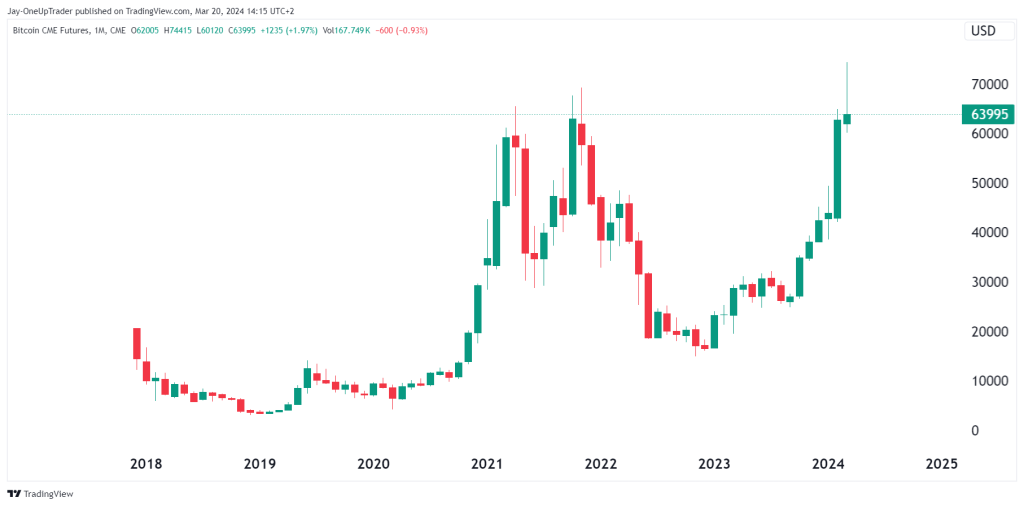
Monthly Chart Observations:
The recent green candle on the monthly chart signifies strong bullish momentum. Despite a slight decrease, the market remains in a strong uptrend on this higher time frame. The only worry is the big wick forming in March. It might lead to a red or flat month for April, but bulls will try to push the price higher after that, moving to the elusive $100K target.
Trade Opportunities:
We should monitor the daily close for confirmation of the reversal. If confirmed, a short-term long position could be considered, with a stop-loss below the low of the reversal candle.