

Introduction
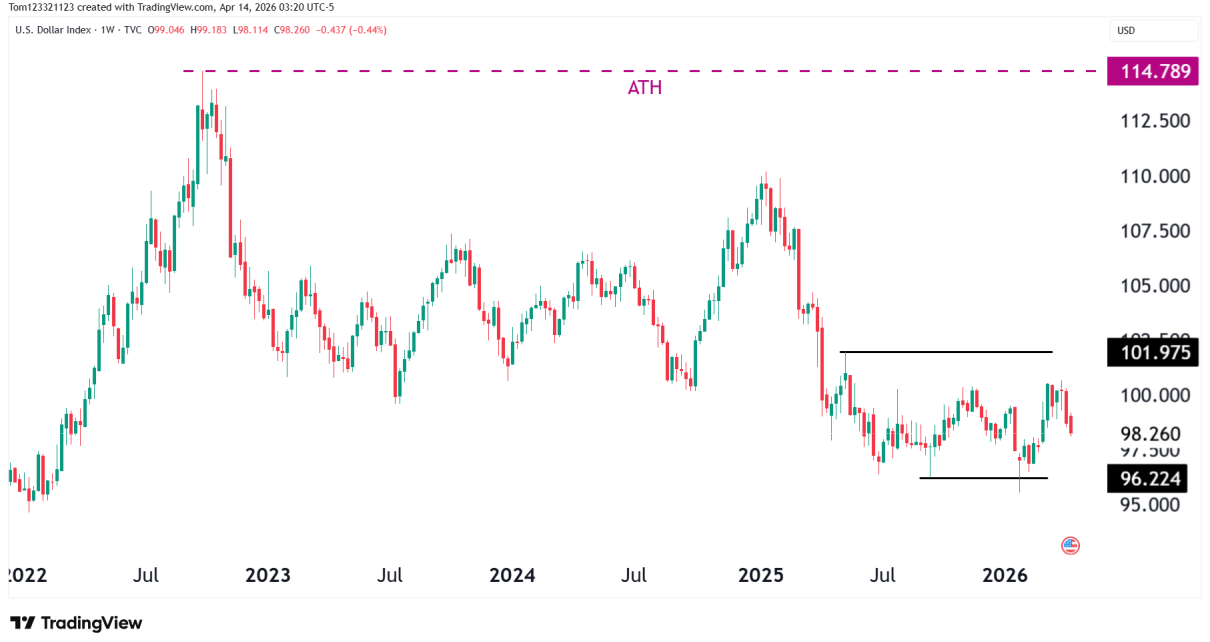
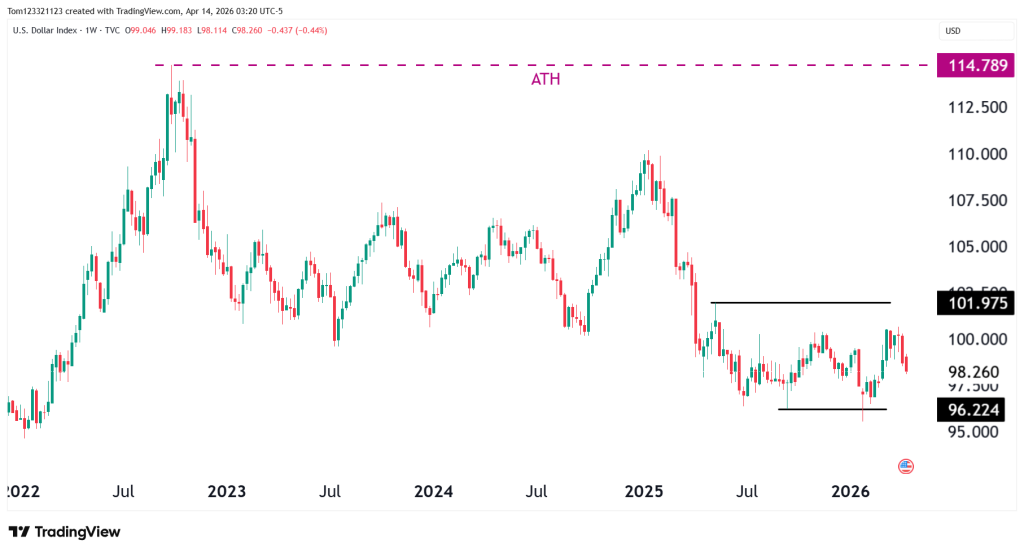
The dollar has transitioned out of its prior uptrend and is now trading inside a well-defined range, roughly between 96.20 and 102.00. The strength we saw earlier in the year was driven by the conflicts in the Middle East. Now that Donald Trump continues to show how unreliable he is, the market is losing faith in the Dollar and it’s selling off.
Right now, price is sitting in the middle of the range. It has pulled back slightly from its 5.5% rally that started in January.
Price Behavior
Rallies into the 100–101 area have struggled to sustain follow-through. Each push higher has faded before it could build momentum. On the other side, selloffs toward 96–97 continue to find buyers, at least for now. Momentum overall has flattened.
Currently, we know that the market is being purely driven by the developments in the Middle East. DXY price remains range bound and will likely stay that way for the rest of the year. This is because the Dollar index is composed of a large basket of currencies, and even with huge developments in geopolitics, it still takes a lot to move DXY.
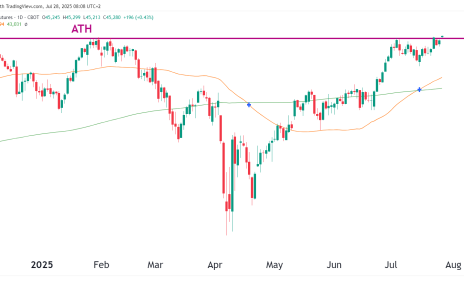
At the OneUp Trader-funded trader program, DXY is not a tradeable instrument, but it helps to better see the picture of what could happen in equities and other markets. Gold, CL, US equities like ES and Nasdaq will all rally if the Dollar weakens and vice versa because it is priced in Dollars. This means that looking at the DXY chart can help do technical analysis on the other instruments.
Key Levels That Matter
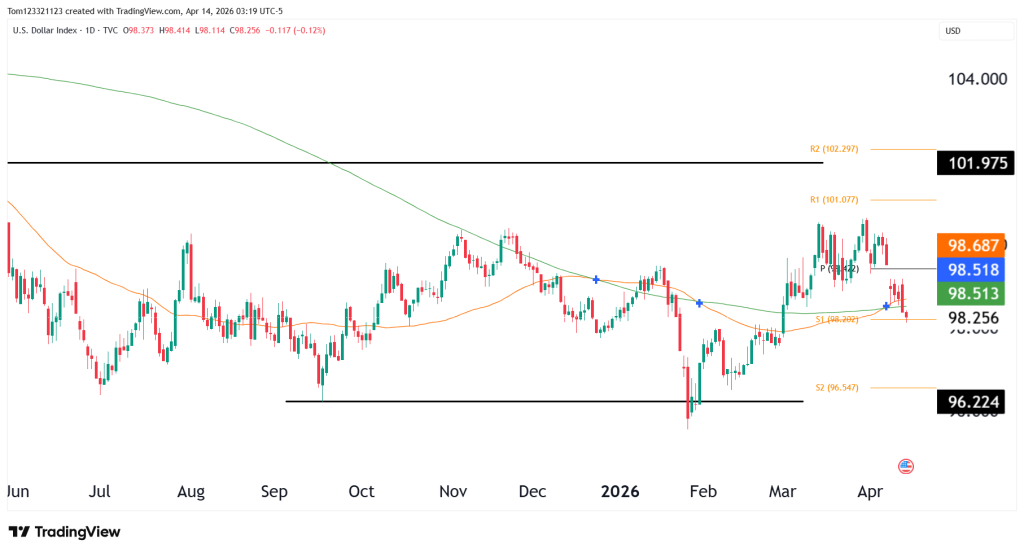
Resistance:
101.50–102.00 (range highs and prior breakdown zone)
Support:
96.20–96.50 (range lows)
Price is currently rotating back toward support.
If this level holds again with a meaningful reaction, then the range remains intact and another rotation toward the highs becomes likely.
But if 96.20 breaks cleanly, the market’s character changes.
Scenarios and Probabilities
- Range holds (40%)
Continued rotation between 96.20 and 102.00, with neither side able to force resolution. - Breakdown (35%)
A clean break below 96.20 opens the door for a deeper move lower, likely accompanied by increased momentum. - Breakout (25%)
A reclaim of 102.00 would signal a shift back into trend and invalidate the current lower-range pressure.
The key shift here is subtle but important. Downside pressure is building, even if it hasn’t fully expressed itself yet.
This analysis is for educational and informational purposes only and does not constitute trading advice. Futures and forex trading involve significant risk and may not be suitable for all investors. Always conduct your own research before making trading decisions.
