

Introduction
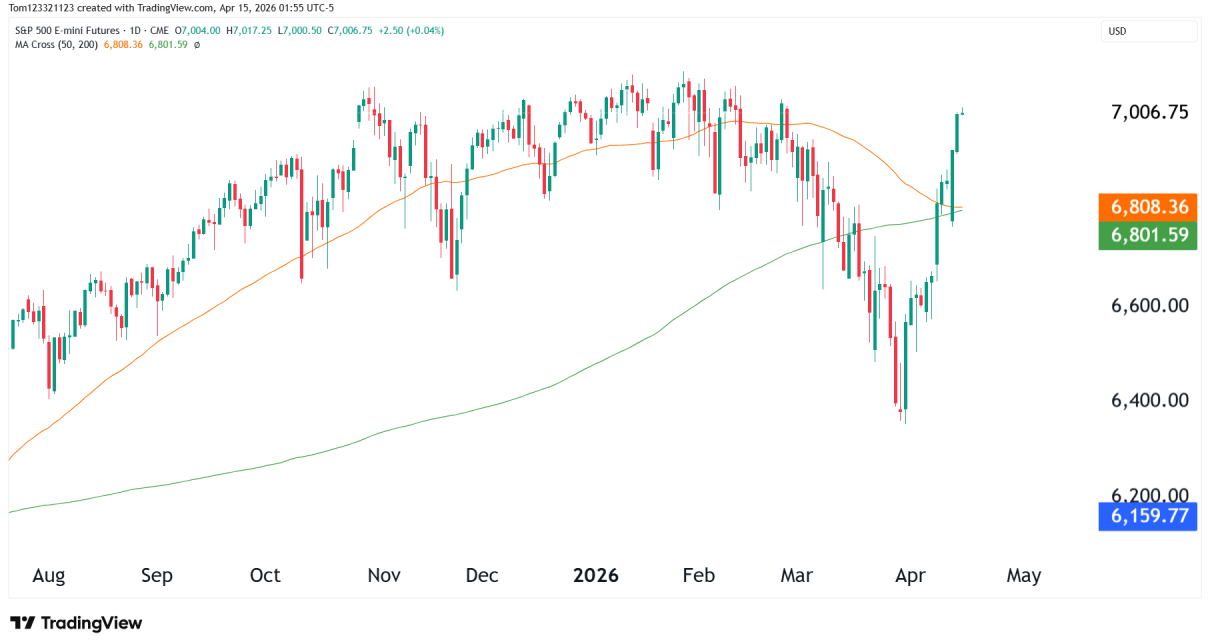
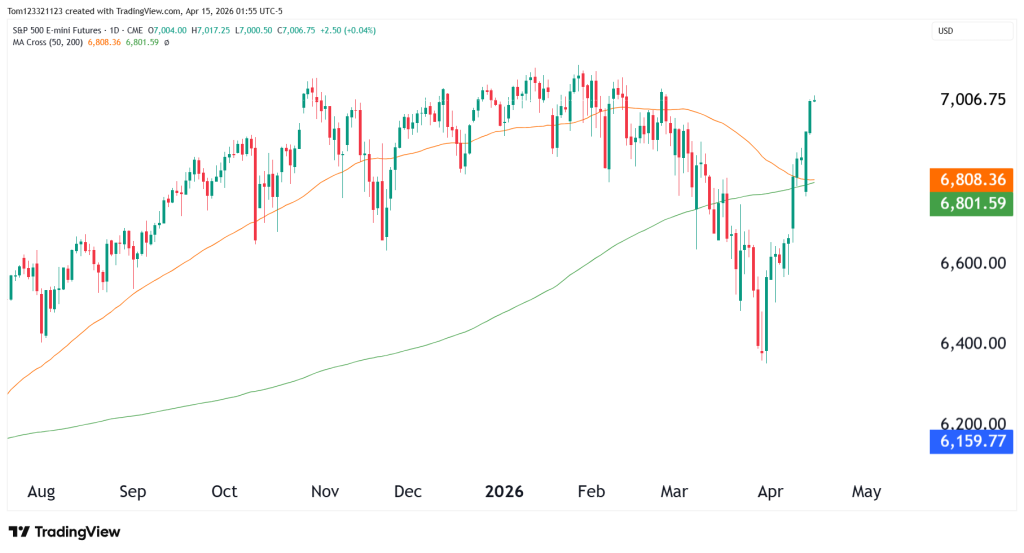
ES has now completed an extreme V-shaped reversal, rallying aggressively from the ~6,300 lows back above 7,000 in a very short period of time. This has happened with help from the weakness recently seen in the Dollar. Earlier in the year, when the conflict began in the Middle East, the Dollar was seeing a lot of strength, which played a role in the decline in the dollar. Now, we are seeing this momentum shift.
V-reversals tend to happen when there are big changes in the geopolitical scene or fundamentals. Basically, the cause is usually not coming from technicals and the V shape reversal is the effect of what the cause is in the first place.
V reversals can be difficult to trade because there is no trend but a sudden shift in momentum. The only who really benefit from these moves are long term investors. Traders who dont get in early before the move begins, are forced to chase the price higher or accept that the opportunity is lost.
With that said, lets take a look at the technicals now that ES is close to all time highs again and see if there are any possible trades to take.
Price Behavior
The defining feature here, and with all V reversals, is speed and volatility.
- Sharp selloff → immediate reversal
- Little to no consolidation on the way up
- Multiple large-range candles stacking higher
This is what happens when we see sudden changes in the macro picture. The market rushes to re price and it enters into price discovery.
And those moves tend to do one of two things:
- Continue squeezing higher if momentum persists
- Stall and mean-revert once the imbalance is filled
Right now, price is pushing into prior highs without having built structure underneath. The key here for traders is to remember that chasing the market higher is risky. It is important to not allow fomo to enter in.
Key Levels That Matter
Price is now interacting with a critical area around:
- 7,000–7,050 (prior highs / psychological level)
Above that:
- Continuation opens, with little resistance overhead
Below:
- 6,800–6,820 (50-day / prior resistance flip area)
- 6,600 (first meaningful support)
The Nature of V-Reversals (What to Watch)
V-reversals are powerful, but they’re also fragile.
Because there’s been no real pullback, there’s no clear area where buyers have proven they’re willing to defend price. From here if ES can hold above $7,000 and consolidate, that is a good sign for the bulls. If price starts falling back below $7,000 then there is chance that 50% of the move gets erased.
Scenarios and Probabilities
| Scenario | Description | Estimated Probability |
|---|---|---|
| Continuation | Hold above 7,000 → grind or squeeze higher | 40% |
| Pullback | Failure at highs → retrace toward 6,800–6,600 | 40% |
| Range Build | Consolidation between ~6,800–7,050 before next move | 20% |
This analysis is for educational and informational purposes only and does not constitute trading advice. Futures and forex trading involve significant risk and may not be suitable for all investors. Always conduct your own research before making trading decisions.