

Introduction
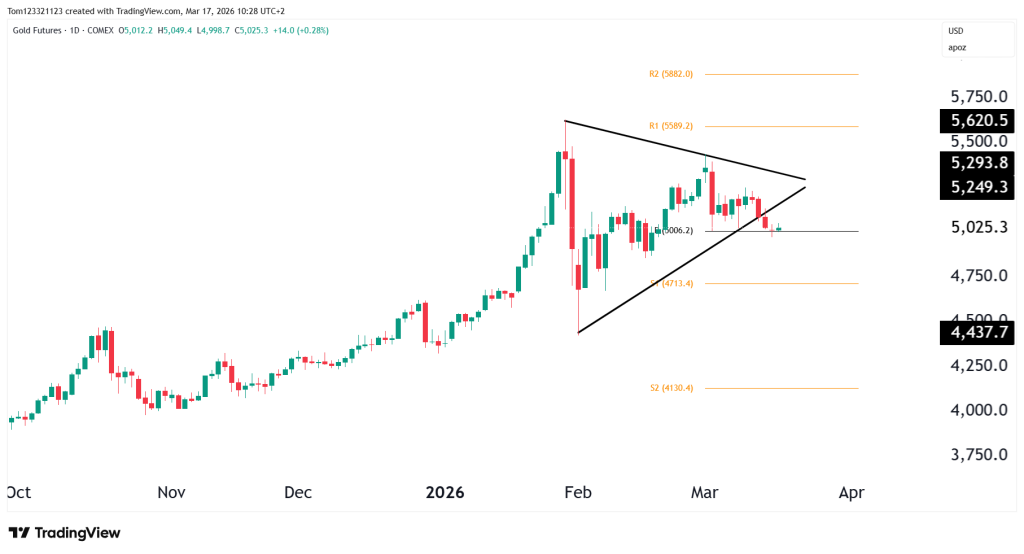
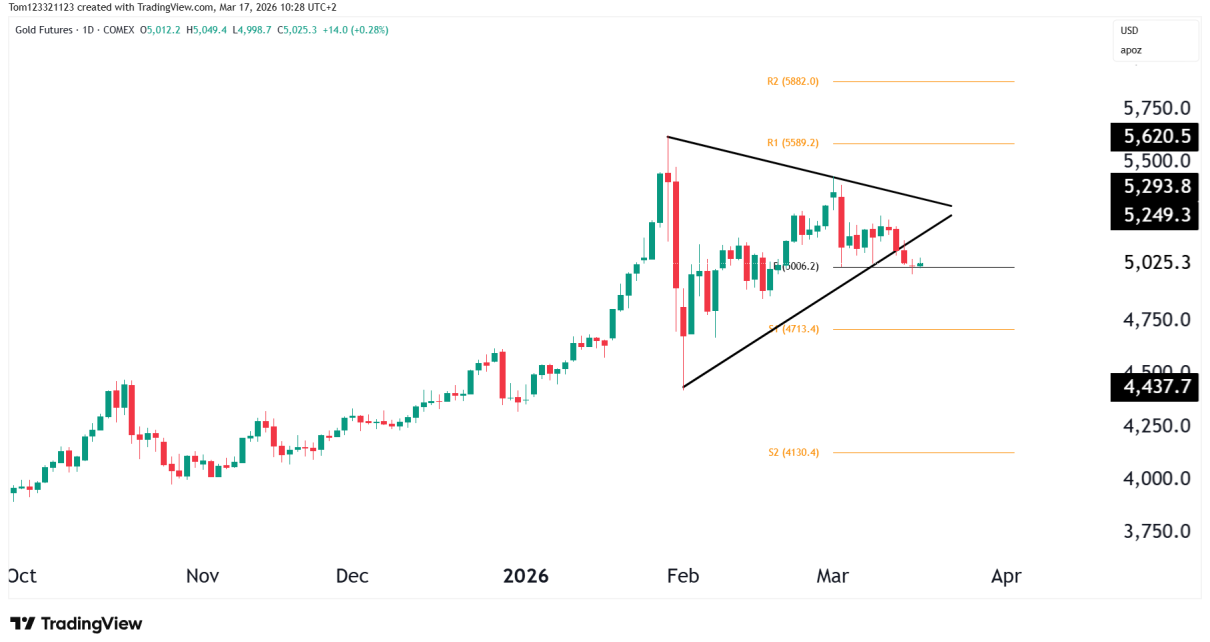
Gold futures (GC) have just broken below the symmetrical triangle on the daily chart and bulls are holding the price up with support being found at the pivot point level.
In the previous analysis, the focus was on a possible expansion for the price. The lack of follow-through so far after the breakout leads us to believe the selling pressure is still just not strong enough to lead to a meaningful bearish reversal. This might be an opportunity for bulls to get in if they missed previous pullbacks.
At the same time, macro conditions remain mixed. While geopolitical tensions and energy volatility continue to support gold, the recent strength in the U.S. dollar (DXY) is beginning to slow the bullish power of gold.
Market Structure & Trend
Daily Chart – Support Under Pressure
The triangle structure is still technically intact, but price is now sitting below the lower boundary. The pivot point is holding the price stable for now, a drop below it could lead to S1 at 4713.4. At the moment, as we have already mentioned, the strong Dollar is basically what has lead to this small decline in gold. Probably, if we see a pullback in the Dollar, gold can move back into the triangle’s range.
Bullish Factors for Gold
- War in the middle east
- Elevated oil prices
- Safe-haven demand
Bearish Factors for Gold
- Strong rebound in U.S. Dollar (DXY)
- Potential tightening in financial conditions
- Reduced urgency for risk off
Key Technical Levels
Resistance
$5,200 – $5,250
- Triangle resistance
- Recent rejection zone
- First level bulls must reclaim
$5,300+
- Breakout confirmation
- Would trigger momentum continuation
Support
$5,000 – $5,025
- Critical support zone
- Triangle lower boundary
- Current battleground
$4,915
- 50-day moving average
- Next major downside level
$4,437
- Structural support
- February capitulation low
Scenarios Going Forward
Bullish Reversal from Support
If buyers step in aggressively at $5,000, gold could bounce back toward $5,200–$5,300 and attempt another breakout.
Breakdown & Pullback
If $5,000 breaks, gold could quickly move toward the 50-day MA (~$4,915).
This would be the most technically clean move given the current structure.
False Breakdown (Trap Move)
Gold could briefly break below support, trigger stops, and then reverse higher.
This type of move is common in triangle patterns nearing completion, especially in macro-driven markets.
Probability Table
| Scenario | Description | Estimated Probability |
|---|---|---|
| Breakdown / Pullback | Price breaks $5,000 support, moving toward $4,915 (50-day MA). | 40% |
| Bullish Reversal | Support holds and price rotates back toward $5,200–$5,300 resistance. | 35% |
| False Breakdown / Trap | Price briefly breaks support, then reverses sharply higher back into the range. | 25% |
Conclusion
The $5,000 level is critical. A clean break below it would likely trigger a deeper pullback toward the 50-day moving average, while a strong defense could set up another attempt at breaking $5,300 resistance.
For traders, this is a high-probability breakout environment, but also a high-risk one. The best opportunities will likely come after confirmation, not anticipation.
This analysis is for educational purposes only and does not constitute trading advice. Futures trading involves significant risk and may not be suitable for all investors.