


Introduction
The U.S. Dollar Index (DXY) had a small uptick in buying pressure after the weekend’s turmoil over the Middle East. Now the greenback is trading at 98.2, and the price spiked 1% after the open.
The catalyst is as follows:
- Escalating Middle East geopolitical tensions
- Renewed safe-haven demand
- Shifting expectations around U.S. fiscal and trade policy
- Political headlines tied to former President Donald Trump and U.S. election positioning
What Just Happened in the Dollar Index?
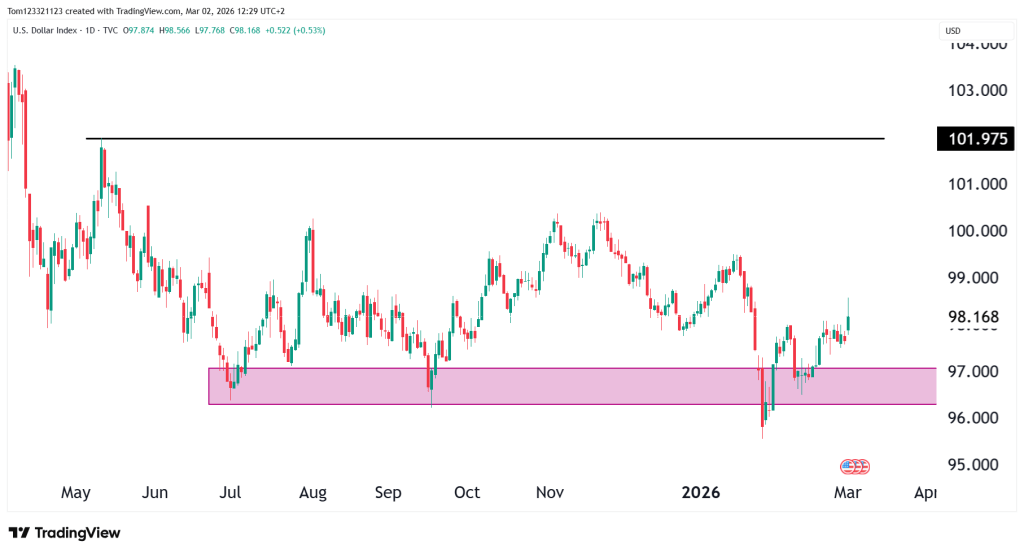
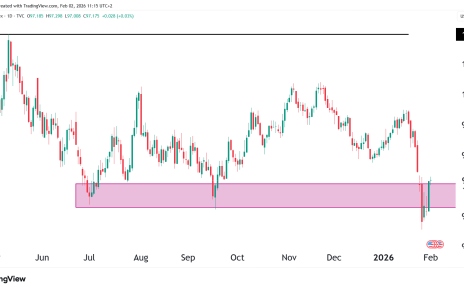
- DXY successfully defended the 96–97 demand zone
- Printed a strong reversal candle
- Broke short-term lower-high structure
- Regained 98.00 handle
A lot hinges on the developments in the Middle East; traders and investors will be watching closely if there are any significant changes that could affect the markets moving forward. At the moment, crude oil appears to be the most impacted market, with DXY not tremendously hit as of yet.
Market Structure & Trend
Daily Chart – Range Reversal Attempt
The daily structure shows:
- Clear horizontal resistance near 101.90–102.00
- Major support at 96.00–97.00
- Range-bound structure for months
- Strong reaction off demand
Key Technical Levels
Resistance
99.00–100.00:
Near-term supply zone.
101.90–102.00:
Major range resistance. Break above this level confirms broader bullish reversal.
Support
97.00:
Primary demand zone.
96.00:
Floor. Loss of this level reopens downside toward 94–95.
Dollar & Intermarket Relationships
Stronger Dollar = Pressure On:
- Gold (if real yields rise)
- Emerging markets
- Commodities (in USD terms)
Stronger Dollar = Typically Coincides With:
- Risk-off equity conditions
- Higher volatility
Watch ES and NQ closely. Sustained DXY strength often pressures tech.
Scenarios Going Forward
Bullish Breakout Scenario
DXY holds above 97 and breaks 100, targeting 102 range highs.
Continued Range
Dollar oscillates between 97–102 as markets digest political and geopolitical developments.
Breakdown Scenario
If tensions ease and Fed turns dovish, DXY could lose 97 and retest 95.
Estimated Probability Table
| Scenario | Description | Probability |
|---|---|---|
| Range continuation | 97–102 rotation | 40% |
| Bullish breakout | Break above 100 | 35% |
| Bearish breakdown | Loss of 97 | 25% |
This analysis is for educational and informational purposes only and does not constitute trading advice or a recommendation to buy or sell any futures contracts or currency instruments. Trading involves significant risk and may not be suitable for all investors. Always conduct your own research and consult with a licensed financial professional before making trading decisions.