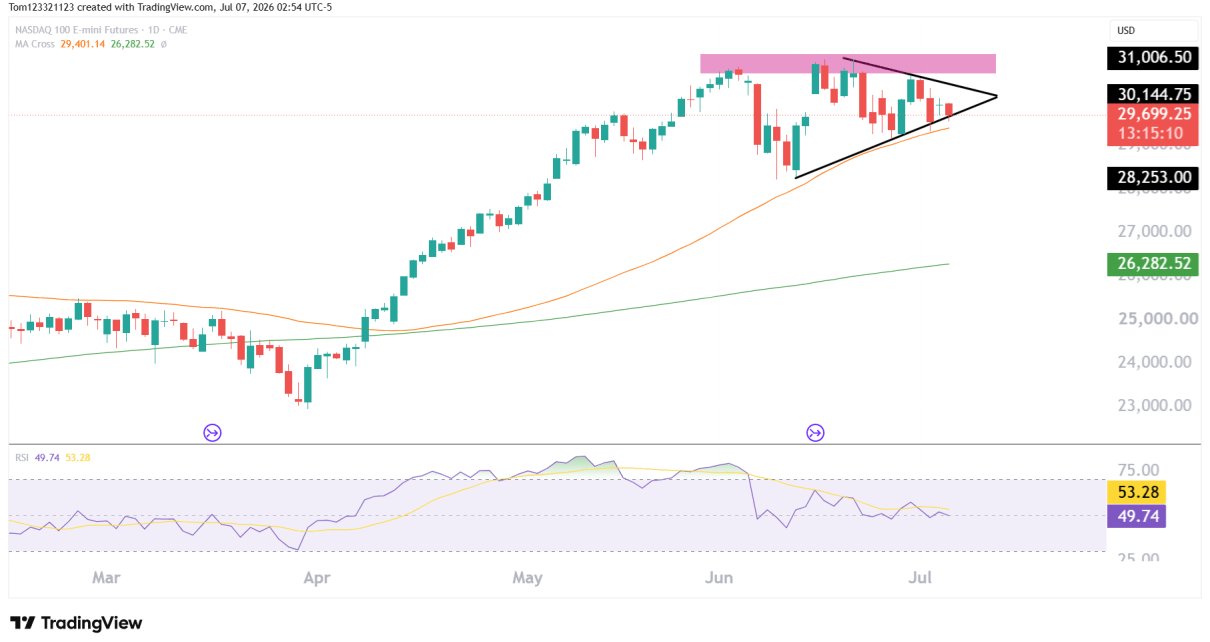
On Tuesday, gold prices rallied to a new high on safe-haven demand amid ongoing geopolitical tensions. Prices rose despite an increase in Treasury yields after upbeat US data. Gold rallies (Source: Bloomberg) Tensions in the Middle East and between Russia and Ukraine have pushed some investors to hedge against any escalation affecting other markets. At Read More…
Tag: stock market
Equities Retreat as Manufacturing Data Alters Rate-Cut Outlook
Equities fell on Monday as investors lost confidence in a June Fed rate cut due to upbeat manufacturing data. Notably, most sectors in the S&P 500 closed the day lower, except energy. This sector gained with oil as the demand outlook improved after upbeat manufacturing data from the US and China. US rate-cut bets (Source: Read More…
New Funded Trader Finds Success with OneUp Trader
Corey Payne from Dallas, Texas is one of the latest ‘scalp style’ traders to receive funding through OneUp Trader. Payne received his $25,000 funded trading account in January 2024 after passing the evaluation in just 17 days. “I chose the $25,000 account size because it offers the best ratio between the profit target and trailing Read More…
Gold Futures (GC) Bulls Over Extended
Weekly Chart Breakout Confirmation The breach of the previous ATH a few weeks ago remains as the most significant event on the Gold chart this year. With that level now acting as resistance near $2089, we could wait for a pullback to take a long position because at current levels, we would be chasing the Read More…
Crude Oil Futures: Technical Outlook
Trade Opportunities and Levels to Watch: Support Levels: Resistance Levels: MACD Indicator: Volume: Trade Strategy: Stay vigilant for any signs of trend weakness or reversal, and remember that trading requires flexibility. If the market structure changes, be prepared to reassess your strategy and manage your positions accordingly. Always ensure your trades align with your risk Read More…
Triangle Chart Pattern Trading Strategy
Introduction The triangle chart pattern is a popular technical analysis formation used by traders to identify potential trading opportunities. This pattern is formed by converging trendlines, creating a triangular shape on the price chart. There are different types of triangle patterns, including: This guide will provide an overview of the different triangle chart pattern trading Read More…