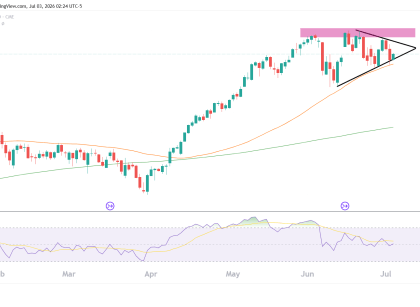
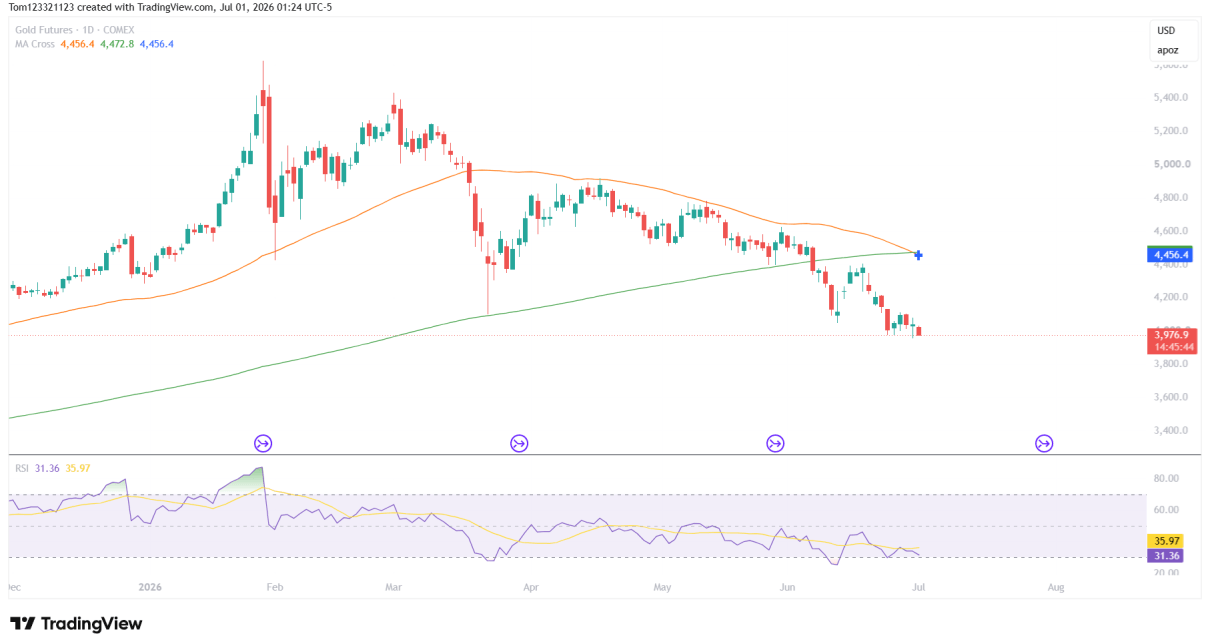
what to look out for when watching a stock
Fundamental Analysis

Equities Retreat as Manufacturing Data Alters Rate-Cut Outlook

Equities fell on Monday as investors lost confidence in a June Fed rate cut due to upbeat manufacturing data. Notably, most sectors in the S&P 500 closed the day lower, except energy. This sector gained with oil as the demand outlook improved after upbeat manufacturing data from the US and China.  US rate-cut bets (Source: Read More…

Crude Oil Futures
Technical Analysis

Crude Oil Futures: Technical Outlook

Trade Opportunities and Levels to Watch: Support Levels: Resistance Levels: MACD Indicator: Volume: Trade Strategy: Stay vigilant for any signs of trend weakness or reversal, and remember that trading requires flexibility. If the market structure changes, be prepared to reassess your strategy and manage your positions accordingly. Always ensure your trades align with your risk Read More…

Strategies

Triangle Chart Pattern Trading Strategy

Introduction The triangle chart pattern is a popular technical analysis formation used by traders to identify potential trading opportunities. This pattern is formed by converging trendlines, creating a triangular shape on the price chart. There are different types of triangle patterns, including: This guide will provide an overview of the different triangle chart pattern trading Read More…

Nasdaq 100 index futures (NQ)
Technical Analysis

NASDAQ Futures (NQ) Trade Opportunities

Weekly Chart Analysis: Key Levels to Monitor: Daily Chart Analysis: Trade Strategy: Before entering any trade, confirm it aligns with your risk tolerance and trading plan. Monitor the trade actively, adjusting stop-losses and targets as the market moves. Stay informed and be ready to act on new information that could influence market direction.