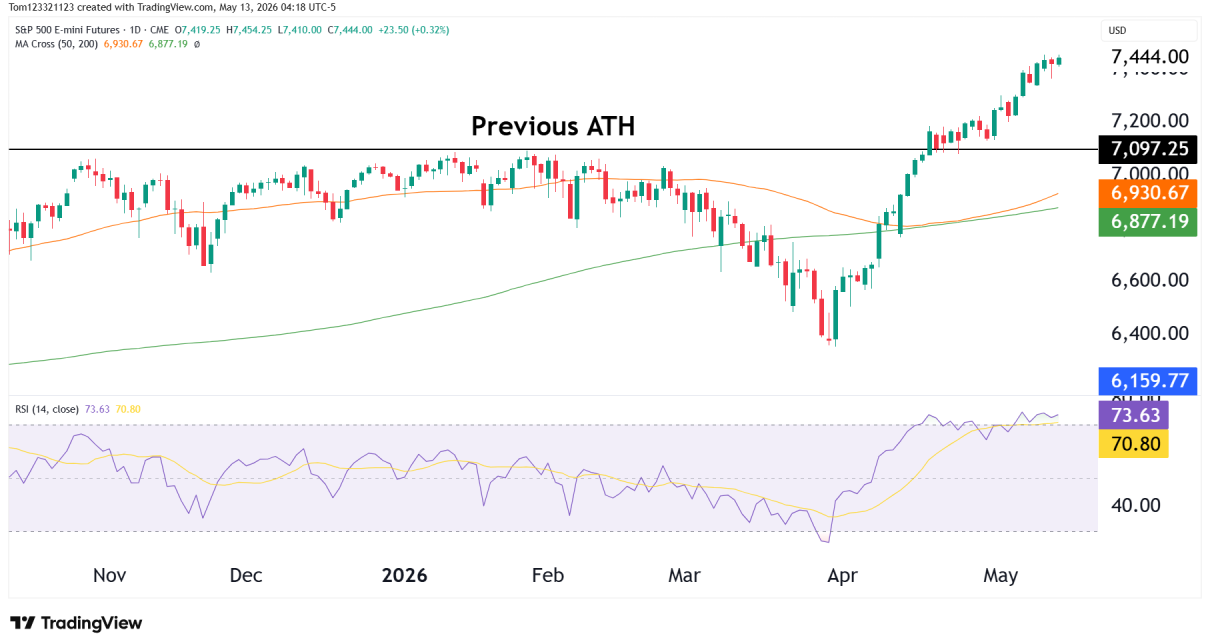
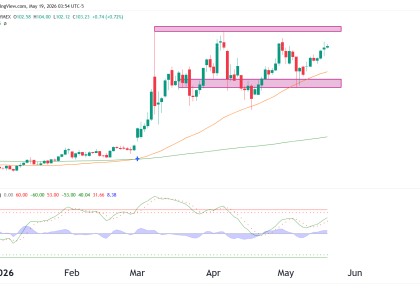

Introduction Bitcoin is no longer in an uptrend. The structure has clearly shifted over the past few months and the question now is whether price is going to find support at the current level and claw its way back up or if its going to continue downward. After topping out near the 120K–130K area, BTC Read More…
Tag: stock market
OneUp Trader Dashboard Review: Features, Analytics, and What to Expect
Introduction Working with the OneUp Trader program platform daily, I thought I’d share what the dashboard looks like, how it works, and the features it offers. If you’re considering a funded trading program or just curious about how these platforms operate, here’s an honest walkthrough of the OneUp Trader dashboard. The dashboard is where traders Read More…
Where Will NASDAQ (NQ) Go Now After Ceasefire?
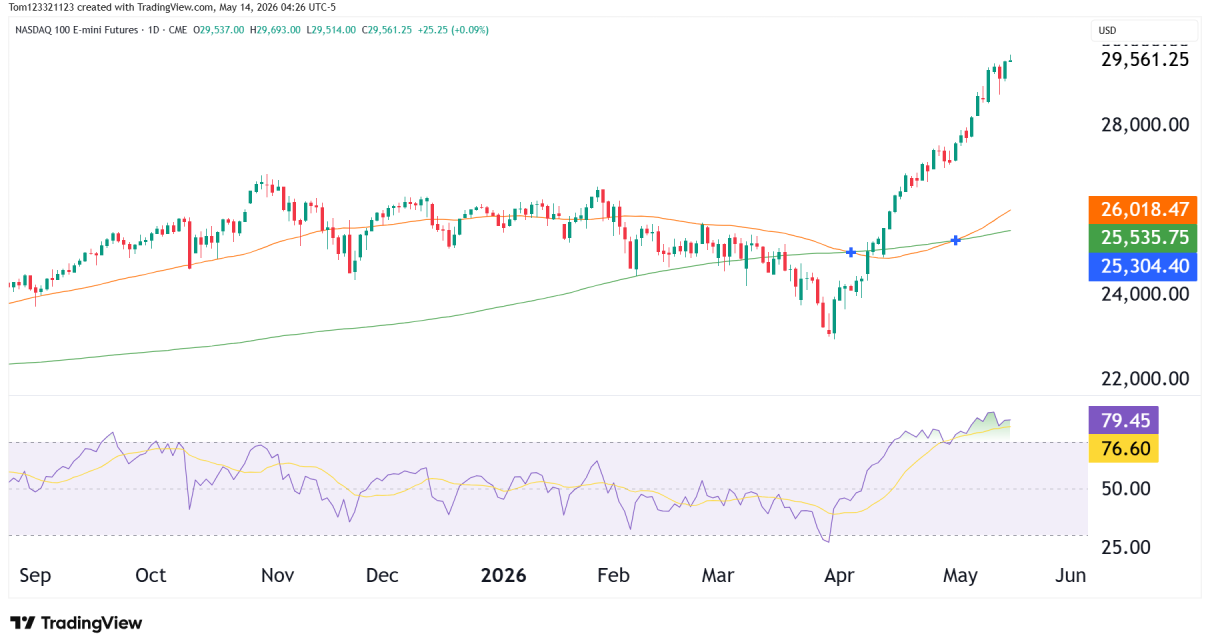
Introduction Nasdaq futures have bounced 10% from their recent low after the news of a ceasefire in the Middle East. This has given the bulls a boost as price is currently trading above both the 50 and 200 moving average. There was a recent death cross where the 50 moved below the 200, but as Read More…
Dollar (DXY) Technical Analysis – 8 April 2026
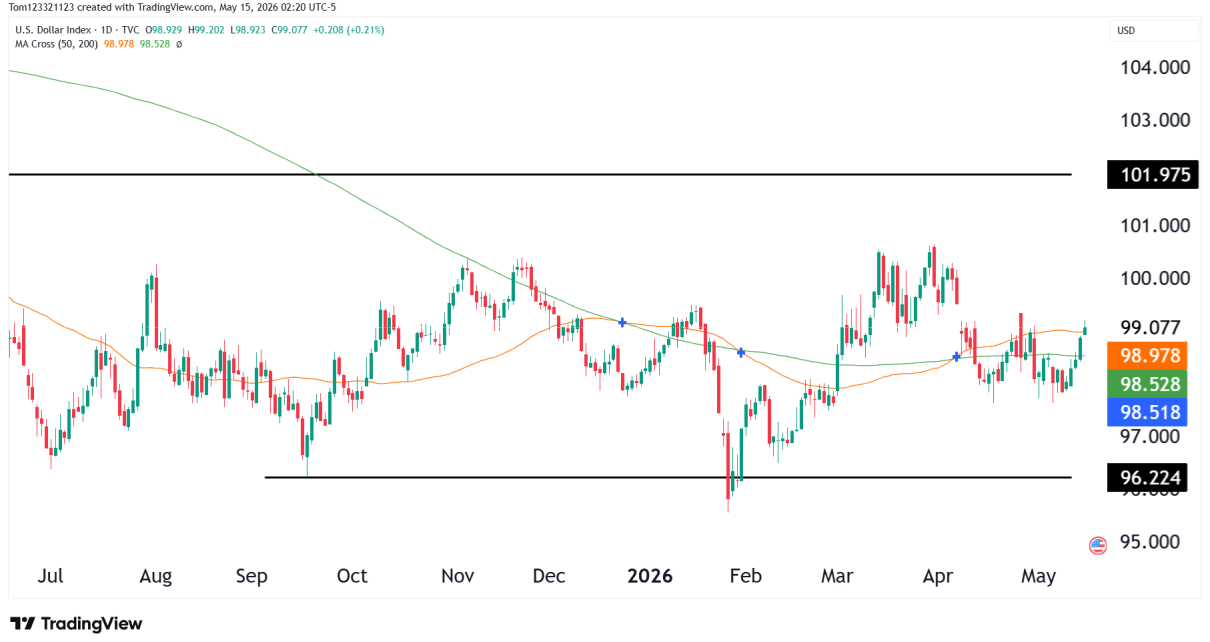
Introduction The dollar is still trading inside a broad range, but the recent price action is starting to lean weaker after the ceasefire in the Middle East. After pushing up toward the 100–101 area, DXY has failed to hold those gains and is now drifting back lower. This is the same zone that has acted Read More…
Crude Oil (CL) Technicals Post Cease Fire In Middle East
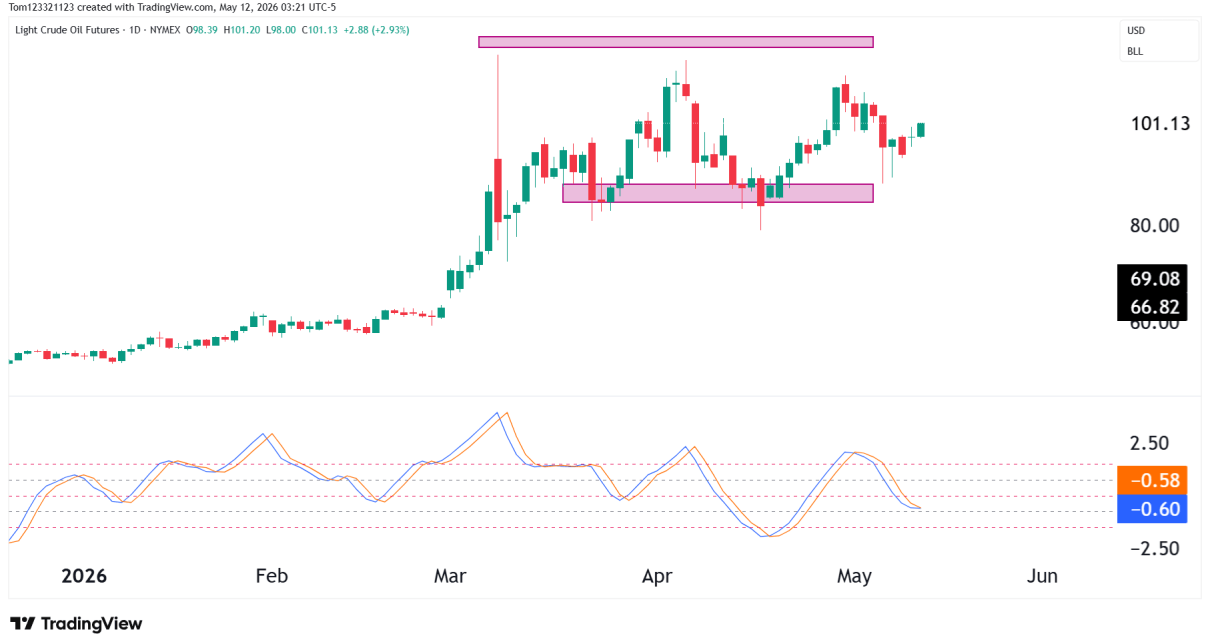
Introduction Crude oil has shifted quickly from a clean uptrend into a sharp corrective move, with price dropping roughly 15% following news of a ceasefire in the Middle East. The Strait of Hormuz has been open for two weeks, allowing the Oil ships to exit and enter the region. This has given some hope to Read More…
The Ultimate Beginner’s Guide to Moving Average Strategies
Introduction A moving average is a widely used indicator in technical analysis that helps smooth out price action by filtering out the “noise” caused by random price fluctuations. It is considered a trend-following, or lagging, indicator because it is based on past price data rather than predicting future movements. The two most common types of Read More…