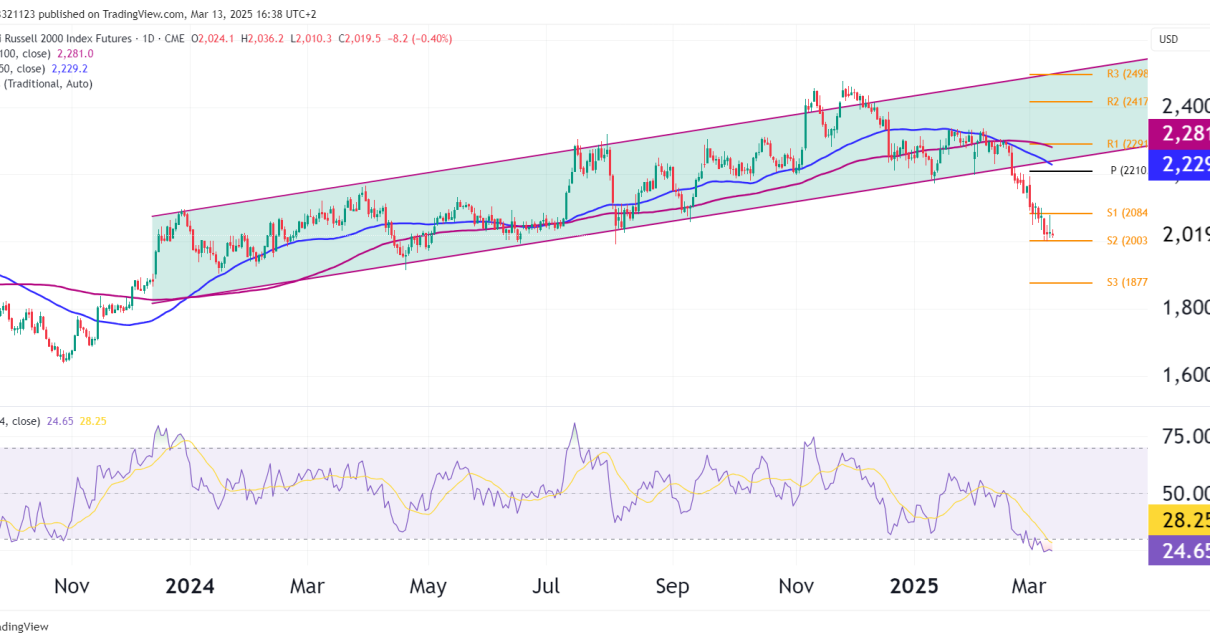
Technical Analysis

Russell 2000 Lagging S&P 500, Technical Outlook 3 June 2025

RTY Underperformance Weekly Chart of RTY: Structure and Trend Bullish Observations: Caution: Daily Chart of RTY Moving Averages RSI (14) Structure Metric ES (S&P 500 Futures) RTY (Russell 2000 Futures) Trend (Weekly) Strong uptrend Sideways, potential reversal Proximity to ATH ~4% below ATH ~17% below ATH Daily Trend Bullish continuation Range/consolidation RSI Momentum (Daily) Above Read More…

Russell 2000
Technical Analysis

Russell 2000 (RTY) – Are Small Caps Ready to Rally?

Technical analysis Price Action: Moving Averages: Key Levels to Watch Type Price Note Resistance 2,050–2,070 Previous swing highs / congestion zone Resistance 2,192 200-day MA Support 1,995 50-day MA support Support 1,850–1,880 April low and major support zone Broader Context – Small Caps Lag, But Are They Catching Up? Bull Case Bear Case Final Call Read More…

RTY technical analysis
Technical Analysis

E-Mini Russell 2000 (RTY) – Breakdown Accelerates as Small Caps Struggle

Introduction The U.S. stock market has been under heavy selling pressure recently, and small caps are no exception. The Russell 2000 (RTY) Futures have broken down from a long-standing uptrend and the price action has shifted bearish. With investors growing increasingly risk-averse, recession fears rising, and sticky inflation keeping the Federal Reserve in a hawkish Read More…

russell 2000 futures technical analysis
Technical Analysis

Russell 2000 hold key support—is a breakout coming?

Introduction The Russell 2000 E-mini futures (RTY) are inside a bullish rising channel, despite recent choppy price action. Small-cap stocks have struggled for direction, but the 100-day SMA (2,299.9) trending upward steadily. As of today, RTY is trading at 2,289.2, up +0.17%, hovering near key pivot levels. Bulls are looking for a decisive move higher, Read More…

rty daily chart technical analysis
Technical Analysis

E-mini Russell 2000 Futures Daily Technical Analysis – January 8, 2025

Introduction The E-mini Russell 2000 Futures (RTY) continues to trade within a well-established bullish channel. The channel is not very strong, but nevertheless, the price is rallying over the long term. Lets take a closer look at the technicals. Technical Analysis Bullish Channel Formation Support and Resistance Levels Indicators Analysis Relative Strength Index (RSI) Bullish Read More…