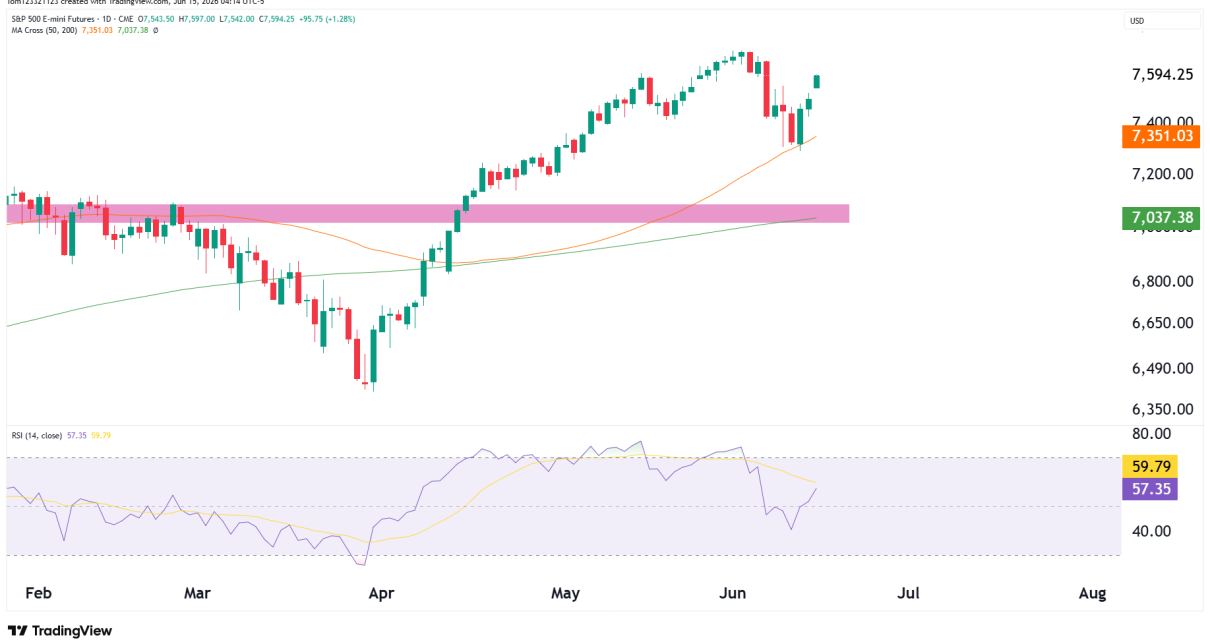
Weekly Chart Breakout Confirmation The breach of the previous ATH a few weeks ago remains as the most significant event on the Gold chart this year. With that level now acting as resistance near $2089, we could wait for a pullback to take a long position because at current levels, we would be chasing the Read More…
Tag: futures trading
Currency Futures Edge Higher on Easing US Inflation
Currency futures edged higher on Friday as the dollar pulled back after inflation fell. However, volatility was low as US markets were closed for the Good Friday holiday. Still, the US released its core PCE price index report, which revealed a drop in inflation from 0.5% to 0.3%. At the same time, consumer spending increased, Read More…
Crude Oil Futures: Technical Outlook
Trade Opportunities and Levels to Watch: Support Levels: Resistance Levels: MACD Indicator: Volume: Trade Strategy: Stay vigilant for any signs of trend weakness or reversal, and remember that trading requires flexibility. If the market structure changes, be prepared to reassess your strategy and manage your positions accordingly. Always ensure your trades align with your risk Read More…
Triangle Chart Pattern Trading Strategy
Introduction The triangle chart pattern is a popular technical analysis formation used by traders to identify potential trading opportunities. This pattern is formed by converging trendlines, creating a triangular shape on the price chart. There are different types of triangle patterns, including: This guide will provide an overview of the different triangle chart pattern trading Read More…
Oil Prices Break Lows, Finish Strong Amid Supply Concerns
On Wednesday, oil prices broke below the previous session’s lows before closing with gains as supply worries continued. Moreover, oil was set to end the month with a 4.5% gain, marking the third consecutive bullish month. Notably, the oil market has grown tighter due to geopolitical tensions. All meetings to try and pause the Israel-Hamas Read More…
NASDAQ Futures (NQ) Trade Opportunities
Weekly Chart Analysis: Key Levels to Monitor: Daily Chart Analysis: Trade Strategy: Before entering any trade, confirm it aligns with your risk tolerance and trading plan. Monitor the trade actively, adjusting stop-losses and targets as the market moves. Stay informed and be ready to act on new information that could influence market direction.