


Historically, market analysts have divided themselves into technical and fundamental analysis practitioners. Still, in the end, every bit of information in the investment market counts, and the consensus has recently become a mix of both approaches.
Considering that each asset’s price represents the consensus of value of all market participants, it is recommendable to understand both lines of research, no matter if you are a purist of one type of analysis.
That being said, fundamental analysis can be a handy tool if you want to start investing or learning about the world of trading.
This article explains what fundamental analysis is, how it differs from technical analysis, the advantages and disadvantages of using it, the main strategies you should know, and how you could use it for an investment decision.
What is the fundamental analysis?
Fundamental analysis is a method that allows you to evaluate the intrinsic value of an asset, determining whether it is correct or out of line with the value it should have; it studies the factors that may influence the price of an asset. Some of the critical components of fundamental analysis are:
- Macroeconomic variables like growth, exports and interest rates. The most important economic numbers are found on economic calendars for mainly currency traders and earnings calendars for equity traders.
- Political conditions.
- Companies’ Financial reports.
Each market, company, country, and asset has its extra variables to look for. For example, if you want to analyze the agricultural futures market, you will have to evaluate seasonal cycles, environmental factors, demand behavior, among others.
The market value of an asset represents expectations based on current data and the context. That is what fundamental analysis looks for.
In Argentina, in August 2019, after a primary election that showed unexpected results, Argentine assets suffered a historic decline hours after. The financial statements of the companies were the same; they did not change in hours. What changed utterly was the outlook for future revenue of all companies.
Fundamental analysis basics
There are multiple tools you can use to apply fundamental analysis to the asset of your choice. In stocks, the company’s earnings are usually the first thing to evaluate, although they alone do not provide enough information.
That being said, the first thing you need to determine is what type of fundamental analysis you want to perform: top-down or bottom-up.
The top-down analysis starts with evaluating macroeconomic factors, such as global growth expectations, projected Gross Domestic Product (GDP), interest rates, exchange rate, and estimated inflation.
It would help if you defined which indicator or indicators to use depending on the asset of your interest. Having a general overview of the market situation and specific indicators will allow you to define your investment strategy better.
On the other hand, Bottom-up analysis has its starting point in microeconomic factors, such as the financial reports of a given company. Those who use it argue that the overall picture of the economy does not necessarily predict all stocks’ behavior.
For example, it may be the case that a company has excellent growth potential (and represents an investment opportunity) even though the sector to which it belongs is stagnant.
Tools for fundamental analysis
Qualitative fundamentals: such as the business model, the power of the brand name, its management, and related regulation. As they are not very tangible, they are hard to measure and, therefore, to take as a reference.
Quantitative fundamentals: these refer to measurable characteristics or metrics used to determine an asset’s intrinsic value. The indicators you choose will depend on the type of asset you are analyzing. For example, if you want to invest in stocks, you can explore the company’s balance sheet, the price-to-earnings ratio (P/E), the dividend yield, etc.
On the other hand, if you want to invest in a particular company, you can choose to apply one of the company valuation methods that allow you to calculate its fair price. The main ones are:
Based on balance sheets or financial statements: Investors value the company through its equity. Adjusted book value, actual net assets, etc., can be used.
Based on the income statement: Traders use multipliers based on profits, sales, or EBITDA (Earnings before interest taxes, depreciation, and amortization) to calculate the company’s value.
Based on discounted cash flows: Investors consider future cash flows to determine the company’s present value. To do so, they use financial cash flow, dividends, etc.
Public companies, those whose shares can be traded freely on a stock exchange, should submit financial statements to the regulator and, therefore, make them public. That data is available and with easy access.
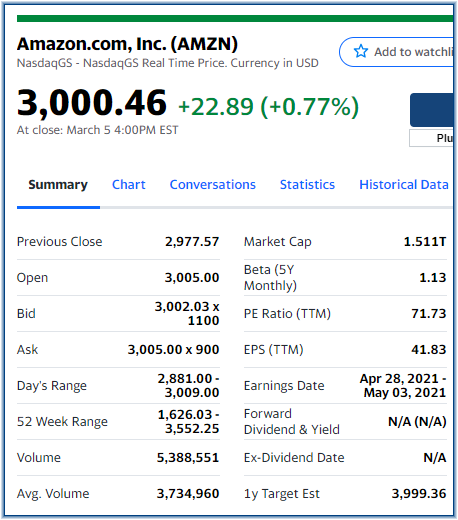
We can take Amazon as an example: every quarter, it presents its corporate results. The results of the fourth quarter of 2020 “beat estimates.” Earning per share totaled $14.09 against the $7.34 expected. The price of the share rose after the results.
As an analyst, you can read the official statement or look for the company site on a financial website. The exchange reveals information about the companies and estimations. In the case of Amazon, Nasdaq offers data, for example.
Fundamental analysis vs Technical analysis
An alternative to fundamental analysis is technical analysis. This considers that prices reflect the psychology of the masses, so they study their behavior through charts, patterns and trends. The two approaches can be complementary or substitutes, depending on the trading strategy you decide to undertake.
For example, you can use technical analysis to determine price levels to trade and fundamental analysis to define the position and assets’ direction.

An expert in technical analysis can look into any price chart and be able to analyze it without the need for further information. When making fundamental analysis and jumping from one asset to another, you will probably need new information, look for a different context and search for other variables.
What are the differences between fundamental and technical analysis? The fundamentals of a stock, company, currency, or any security go from general economic data to particular economics to management. It is a very broad perspective; when you do technical analysts, you already have all the information you need in the chart. Also, read about Technical Analysis.
Advantages and disadvantages of fundamental analysis
Fundamental analysis allows you to gather the information you need to trade rationally in the market, thus avoiding acting on impulse or emotion. Besides, by understanding the fundamentals underlying the value of an asset, you can gain a holistic and long-term understanding of the market. Knowing this, you can profit by taking advantage of market corrections that occur when assets are over-or undervalued.
On the other hand, fundamental analysis has the disadvantage of the time it takes to conduct complete research of the market or economic sector of interest. Although this is reduced with practice, it can be tedious at first.
Another disadvantage is that it is not a very useful tool for making short-term decisions, where technical analysis is usually recommended.
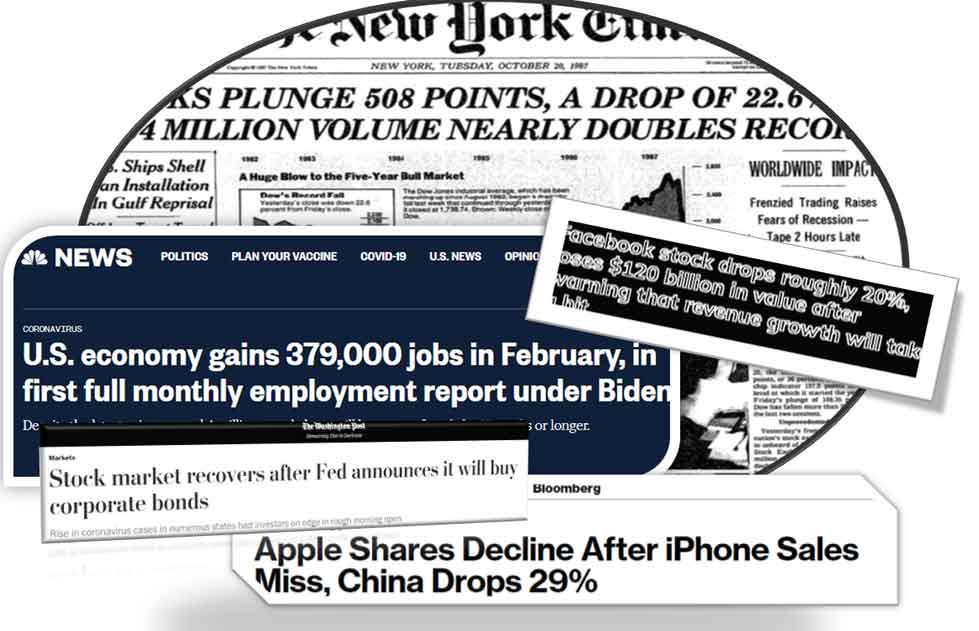
Finally, contingencies may occur, such as the Covid-19 pandemic, which generates unforeseen shocks on the markets and cannot be predicted by fundamental analysis.
More than price to earnings ratio and book value
Fundamental analysis is a powerful tool when it comes to investing. Whether you decide to apply it individually or accompanied by a technical approach, it will provide you with valuable information when making futures, forex, or stock analysis decisions.
The fundamental analysis approach is more than earnings ratio, book value, or growth rates. It tries to find the intrinsic value of an asset, which can provide you with significant investment opportunities combined with chart patterns or technical indicators.
Experience and learning about so-called “Intermarket relationships” could be an interesting place to start. Do you need to be an economist or a financial advisor to trade on fundamentals? No, but your profit margins will cheer your proactiveness to study and learn new things.
References and bibliography used in this article


