

You should have heard about volume, price movements, a moving average, support and resistance levels, and overall, technical analysis. It is more popular than you think. Almost all investors in the financial industry follow price action analysis and technical analysts are among the best-known people in the market. But why?
The reason is clear, history tends to repeat, so do the price movements of all assets in the industry. No matter if you are trading futures or the stock market, if you are a long or short-term trader, technical analysis is present in almost all trading strategies.
This article explains what technical analysis is, how it differs from fundamental analysis and why it is important for trading markets. Let’s talk about how long-term investors and day traders can use chart patterns, support and resistance levels, trend analysis, oscillator work, volume analysis, just to name a few common technical approaches.
You´ll also have some tips to choose the trading strategy and trading platform that best suits you to keep practicing and learning technical analysis.
What is technical analysis?
Some people define it as a science, others as a kind of art, but the truth is that technical analysis is something we have all heard of. Experts consider that technical analysis was born with Charles Henry Dow and his theory, towards the end of the 19th century.
The advancement of technology and personal computers in the 60s, and later the increased availability of information over the Internet have made technical analysis accessible to everyone. You just need to understand a few basic concepts, practice with simulators and dare to invest.

In a few words, technical analysis is the market study, mainly evaluating the price movements and market volume by looking at charts. Both parameters are impacted not only by market participants’ actions but also by the supply and demand cycles of assets.
The fundamental premise of this analysis is that the future situation of an asset can be predicted by analyzing its past behavior. This is based on the Dow Theory, which is based on three pillars:
- Price discounts everything: Past, present, and even future information are discounted in prices.
- History repeats itself: Because agents follow patterns of mass behavior.
- Price movement is driven by trends.
Technical tools are easily applicable to a wide range of assets (including futures markets), adapt to different periods of analysis, and are intuitive to use. However, technical analysis can be subjective if we allow emotions and psychological anchors to intervene and of course, it cannot predict the future price, just offer clues about what might happen with price action in the future.
Technical vs fundamental analysis
As an alternative to technical analysis, some experts prefer to analyze the economic forces that influence the supply and demand of assets to predict market behavior. They turn to fundamental analysis.
The fundamental analysis makes it possible to identify whether assets are undervalued or overvalued in the market. Professionals use socio-economic data and financial results (annual results, public announcements, etc.) to perform a more in-depth analysis.
Both analytical approaches can be considered mutually exclusive or complementary, depending on the strategy you want to implement. If you prefer to buy and sell assets with a short term time horizon for profit, it is advisable to opt for technical analysis; while, if you prefer to analyze which asset to keep in your portfolio and hold it for a longer period, fundamental analysis will be a better ally.
It does not have to be one or the other. As a trader, you can look for technical analysis patterns while at the same time consider short-term implications of economic releases prior to setting up a trade. You will be using both.
Technical indicators in futures trading
Technical analysis plays a very important role in the futures market, especially considering that each one has its own trading personality. This requires combining measures of trend, momentum, and volatility (mainly MACD, RSI, Stochastics and Bollinger Bands) to trade with confidence and to be able to identify trading opportunities more accurately.
Some of the advantages of technical analysis is the possibility of limiting losses in relation to invested capital, estimating potential profits and overcoming some of the drawbacks of using fundamental analysis.
For instance, large influx of speculative capital into and out of the market can generate liquidity-driven price oscillations that are difficult to explain with fundamental analysis. Not even all of the methods used in technical analysis are able to comprehend capital flows.
Do you know how you can start trading with no money? Read Who can Become a Funded Trader now!
Technical analysis basics
1. Charts – How to read the price movement
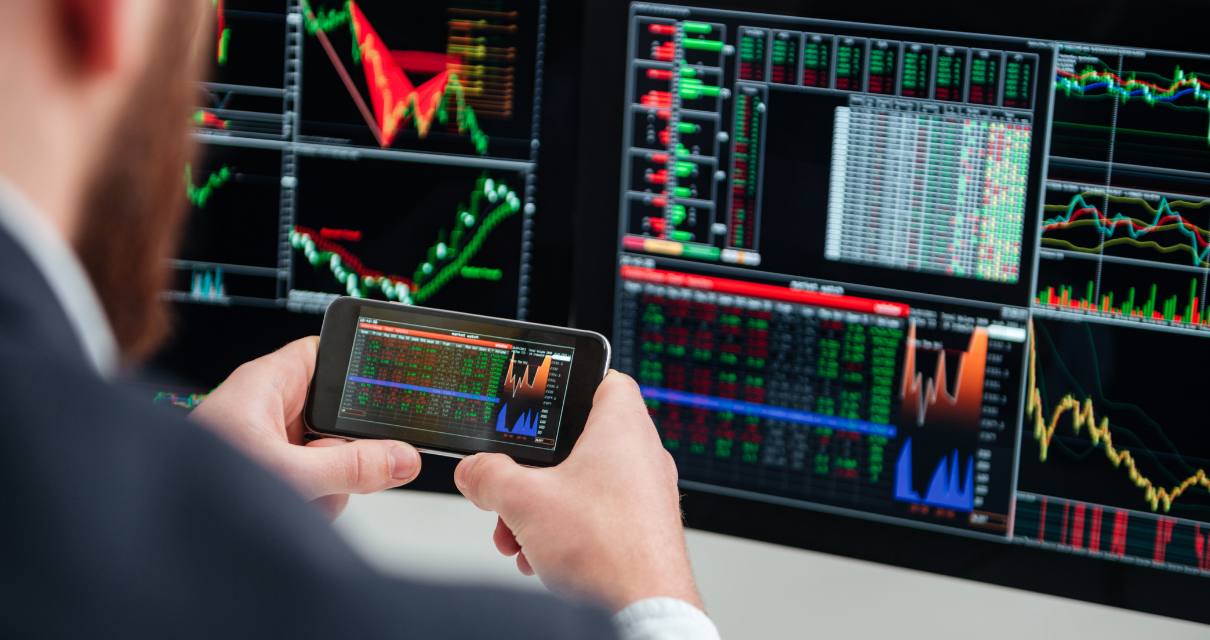
There are different types of charts depending on the information you want to obtain from them: bars, lines, candlestick, and point and figure.
The bar chart is usually the most commonly used because it is easy to construct and interpret. The vertical axis represents the prices, and the horizontal axis represents the chosen time frame. Each one shows the open, high, low, and closing price for a particular time period.
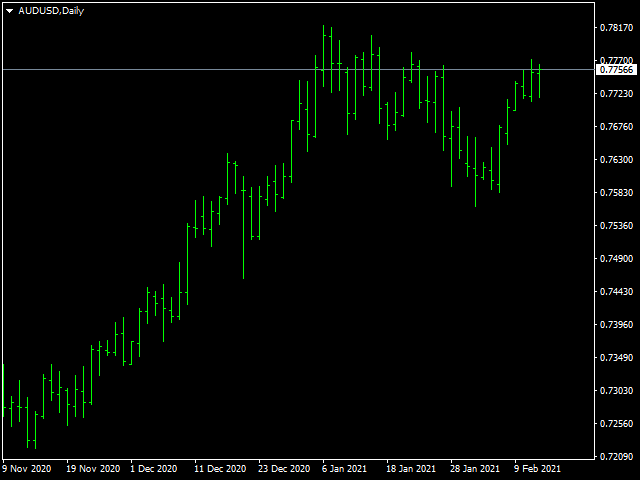
Another standard chart in technical analysis is a Japanese candlestick chart. In a “more visual” format, they display the same information as the bar chart.
By means of a vertical line, they show the variation between the high and low prices and use the candlestick’s body to represent the range between the opening and closing prices.
2. Time frame
On the horizontal axis, you place the time frame you want to use to analyze the chart. For example, if you select a candlestick chart, and a time frame of one hour, each candlestick will represent the price evolution of the asset in one hour.
You may be wondering what the best time frame for technical analysis is… and the truth is that there is no single answer. It depends on several factors, such as the strategy you choose or the objectives you intend to achieve through your investment.
Also, you have to consider the moment you are trading. Maybe the hourly chart is giving a trade sign, and you look into the five-minute or one-minute chart for more information to find a more accurate entry-level according to your technical analysis.
Large time frames are usually used when you make few trades, have long-term objectives, or when the news has a residual effect on the asset under analysis. On the other hand, small time frames are more frequent when many operations are performed, quick decisions must be made, or trading is highly influenced by the news.
3. Trends
According to both fundamental and technical analysts, a trend can be defined as the direction in which a market moves steadily over a given time interval. Generally, they can be classified into uptrends, downtrends and sideways trends (or no trend).
An uptrend (“bull market”) refers to a sustained upward price movement. It is characterized by buoyant demand exceeding supply, causing prices to rise. Optimism and confidence are the prevailing sentiments in these cases. In opposition, the bear market refers to a sustained decline in price. Pessimism and fear of losing money drive people out of the market. Selling pressure then outweighs buying pressure, causing prices to decline.
Finally, the sideways trend is the one that occurs when the market is undecided. The price of the asset oscillates in a narrow range, between supports and resistances, without major variations over a given period of time. Actually, most of the time, price action moves sideways; if the range is wide enough, you can use a so-called “swing” trading strategy based on technical analysis to trade inside the range extremes.
4. Chart Patterns – history tends to repeat itself
Technical analysts, also characterized as “chartists”, limit themselves to evaluating the evolution of prices (and secondly, of volume) without considering any fundamental information. They consider that the patterns (or shapes) they observe on the charts already have any fundamentaly driven expectations discounted in.
Broadly speaking, two types of patterns can be distinguished: those that indicate continuity of the current trend and those that indicate a change with respect to the current trend.
As continuation patterns, you can see some of the following formations: triangles, channels, flags, pennants, or gaps. Among trend reversal patterns, you will find figures such as “head and shoulders”, “double top” and “double bottom”, spikes, among others.
Identifying price movements: Types of technical indicators
Volume and momentum indicators
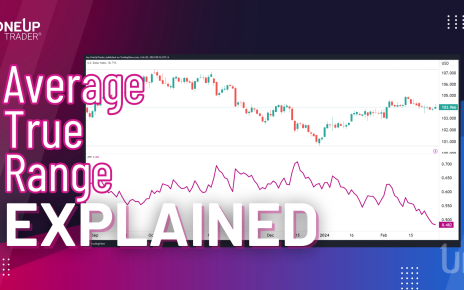
In technical analysis, the momentum indicator measures the rate of change in prices for a certain period, whether it accelerates or decelerates. This means that if the price has been growing by 5% per month, and suddenly grows by 15%, momentum will increase.
This indicator is usually accompanied by the volume indicator, which indicates the number of shares traded in the period. If a lot of volume and momentum accompanies the rise, the price appreciation is confirmed. It is also combined with other technical indicators.
Oscillators
They are technical indicators based on statistical and mathematical calculations on the price of assets, which oscillate in a range, provide buy and sell signals when they enter or leave certain zones.
For example, Stochastic oscillates between 0 and 100. Below 20, the price is considered to be “oversold”, and above 80 “overbought”.
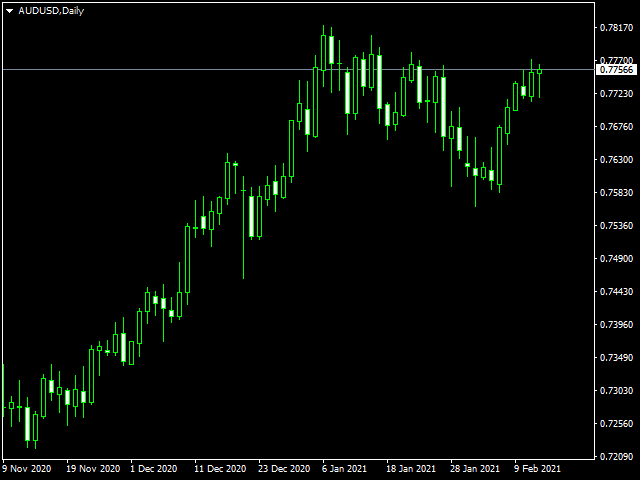
Moving averages
This is the average price for the period under consideration. It could be set up for the close, open, high, or low price. If you chose the close, the 10-day simple moving average is equal to the average of the last 10 days’ closing price.
It is an important indicator in technical analysis because it will allow you to know the asset’s relative value with respect to its average value. Also, a moving average level can be considered dynamic resistance and support levels.
Support and resistance levels
Support represents the level at which the price movement resists further downward movement. According to technical analysis, it can become a point where a rebound to the upside occurs. Resistance, on the other hand, represents the technical level at which the price action resists further upward movement.
There are simple and more complex indicators. Technical analysts do not use all of them at the same time. A correct chart setup includes just a few indicators, usually one for trend direction and momentum, another for volatility, and a volume indicator as a means to get further confirmation.
Tips and risks from Technical analysts
Not everything is rosy in technical analysis and trading. Sometimes you will make a profit, and sometimes you will have to face losses, so you should know that every type of investment involves certain risks.
Based on the objectives you intend to achieve or based on your profile as a trader, it is possible to define a level of risk that allows you to operate feeling comfortable, without too many worries.
As a technical trader, it is important to know some of the types of risks you may face:
- Market: risks emerging from price fluctuations. You can set targets, and in unusual times prices can make large gaps, surpassing those levels.
- Operational: risks related to the broker or exchange, transaction costs; particularities beyond markets.
- Investment: the risk from the composition of a portfolio and the capital variation in the account.
To face these risks, you could take into account some tips:
- Plan: you should establish (in advance) stop-loss and take-profit points, according to your objectives, in order to determine the course of action of your investment.
- Understand the risk inherent to each market: specific factors influence some markets more than others. Knowing them and sizing their impact will allow you to develop appropriate investment strategies.
- Evaluate the risk-return ratio: you should honestly compare the risk involved in carrying out a trade with the return you could potentially obtain.
- Diversify: you should not put all your eggs in one basket. Diversifying your investments will allow you to reduce risks while opening up more opportunities.
- Do no use your funds if you don’t want to: You can apply for a funded account, and you keep your money away from yourself. Companies like ONEUP offer funded accounts.
The funded trading way
When it comes to talking about technical traders, one of the most important factors to consider is capital. As you may know, both fundamental and technical analysts advise that you never should trade money you can’t afford to lose.
In that framework, a new generation of investors is experimenting with funded trading programs where they can buy and sell assets with someone else’s money.
They do the same as any other trader. They follow technical analysis, price movements, use technical indicators to identify support and resistance or the moving average, and invest in short and long term positions. However, the difference goes as they partner with another person who gives them working capital for a share of the profits.
Becoming a funded trader on the right platform could be one of the smartest trading decisions a person could ever do. In the end, you will try with peace of mind and more controlled psychology as the risks of losing your own money will be limited. Interesting, don’t you think?
What is the right strategy for you?
Choosing a trading strategy involves defining how you will trade the market. It determines at what prices you will decide to buy or sell, how you will manage risks, and it should be in line with your investor profile. You must learn to control your emotions and not let them intervene in the strategy.
You should consider that this will take time and practice. It is advisable to open a demo account with a regulated broker and trade regularly. This will allow you to identify the elements you should incorporate into your strategy and then test it for several weeks.
The performance you obtain will depend on the financial market in which you trade and the instruments you use.
How to pick the right trading platform for technical analysis? Fortunately, we live in an era where access to information is just a few clicks away. Today, performing technical analysis with real-time charting tools is within reach of anyone with internet access.
There are excellent technical analysis platforms such as tradingview.com and investing.com, and it is also possible to use PC-based platforms such as NinjaTrader, MetaTrader and MetaStock. Many sites offer a large community and are free to register or download.
Is technical analysis for me?
The world of trading is fascinating and even more so if you learn to perform technical analysis. Other tools, such as fundamental analysis, can also be useful.
With practice, you will be able to define your own trading strategy, determining the indicators and charts that best suit it. In addition, you will learn how to interpret changes in the market and manage your risks.
Technical and fundamental analysis can help you reach your target. For those analyses to be useful, you will have to be honest with yourself. Use technical analysis only if you feel comfortable with that. Do not force yourself.
The trajectory that you set up using your analysis and a rational risk management strategy could be appropriate, but you will need the discipline to follow it at all times.
