

Introduction
Traders are always looking for that edge to beat the market – some hidden gem that can help them make easy and predictable profits. Well, you’re in luck because the moving average indicator might just be that secret weapon you’ve been searching for.
These powerful yet often overlooked indicators can help you determine market trends, spot potential reversals, and make more informed trading decisions. Let’s break down everything you need to know about using moving averages to gain an advantage in the market.
What is a Moving Average (MA Indicator)?
A moving average (MA) is an essential statistical tool used across financial analysis to identify and follow market trends. It works by smoothing out the natural volatility and noise in price data to reveal the underlying direction. The moving average formula calculates the average closing price over a defined lookback period – for example, the past 20 days. As each new day passes, the oldest data point is dropped, and the latest price is added to the calculation. This creates a constantly updated dynamic average that traders can overlay on price charts.
The two most common types are the simple moving average (SMA) which weights all prices equally, and the exponential moving average (EMA) which gives more significance to recent data. Moving averages are powerful yet easy-to-use indicators that all technical traders rely on to visualize trends, spot potential reversals, and time entries and exits. With the ability to cut through the noise, moving averages provide clarity in even the most volatile markets.
How to Calculate Moving Average
The calculation behind the moving average is straightforward yet incredibly useful when done correctly. To find the average price, you simply sum the closing prices over a set lookback period and divide by that period count. For example, a 10-day simple moving average involves adding the most recent 10 closing prices together and then dividing by 10. This produces the average price over those 10 days. As each new trading day passes, the oldest data point is removed from the calculation, and the latest closing price is added in. This keeps the lookback period constant while updating the average to reflect the most recent price action.
Modern trading software performs this sequential calculation automatically, sparing traders the manual work. However, understanding the method is still key, as it provides critical insight into the indicator’s underlying mechanics and lagging nature. Though simple in principle, the moving average formula reveals powerful market insights no trader should be without.
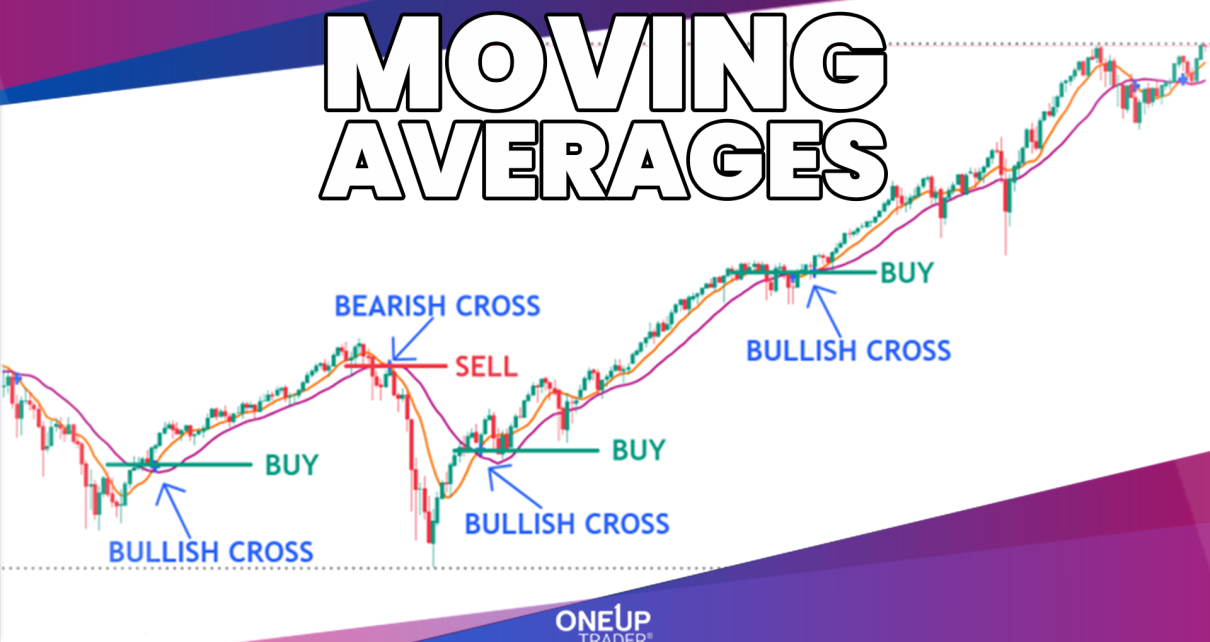
What is a Moving Average Crossover
Moving average crossovers occur when two moving averages of different lengths intersect, signaling a potential trend change. A classic strategy combines a short-term moving average, like a 50-day, with a longer 200-day moving average. When the faster 50-day crosses above the slower 200-day average, it generates a “golden cross” – a bullish indicator foreshadowing rising prices ahead. The opposite “death cross” formation suggests a bearish near-term outlook. However, crossovers often emerge after a trend begins, rather than predicting it due to the lagging nature of moving averages.
Savvy traders thus use crossovers more as trend confirmations rather than entry signals. The crossover implies the trend may be shifting, but alternative leading indicators are better suited for timing actual entries. Nonetheless, crossovers remain a simple yet powerful tool for assessing overall market direction.
What is a Simple Moving Average (SMA Indicator)
The simple moving average (SMA) is arguably the most popular and widely used trend indicator in all of technical analysis. As the name implies, it is calculated by straightforwardly taking the average closing price over a defined lookback period. This has the effect of smoothing out price volatility to help identify the underlying trend. A 50-day SMA, for example, averages the prior 50 daily closes to plot a moving trendline. As each new period ends, the SMA is updated by removing the oldest data point and adding the newest close. Traders rely on SMAs to visualize direction, spot potential support and resistance levels, and look for crossovers with the price itself or other moving averages to generate trade signals.
The simplicity of the SMA makes it an ideal gauge of the prevailing trend across any time frame. While basic in construction, the wisdom of crowds shines through in the SMA to reveal the true market tempo.
How to Calculate Simple Moving Average
The elegance of the simple moving average lies in its straightforward calculation. To build an SMA, you first select your desired lookback period, say 20 days. Next, add the closing prices from the most recent 20 trading days. Finally, divide this total by 20 to generate the average price for the period. This becomes your 20-day SMA. Each new day, the oldest closing price is removed from the calculation, and the latest day’s close is incorporated. This causes the SMA to move dynamically over time, reflecting the updated average price. Traders plot the moving SMA as a trendline on the price chart. As the SMA moves higher or lower with each refresh, analysts can easily visualize the trend direction. Moreover, crossovers with the price or other averages form trade signals. The basic SMA formula translates closing prices into an invaluable trend proxy that all traders should integrate into their analysis.
Simple Moving Average Trading Formula
The power of the simple moving average stems from its straightforward calculation. The SMA formula consists of just summing up the closing prices over a chosen lookback period and dividing by that period. For example, a 50-period SMA = (Sum of closing prices over 50 periods) / 50. This gives the average, or mean, price over the timeframe. As the formula updates with each new period, the SMA line moves dynamically with price action. This valuable indicator helps traders visualize the trend, identify support/resistance levels, and spot crossovers with price or other moving averages for trade signals.
When price crosses above the SMA, it indicates upside momentum and a potential long entry. Crossing below suggests downside momentum for a possible short entry. While basic in design, the elegance of the SMA formula is how it distills raw price data down to the core trend.
What is an Exponential Moving Average (EMA Indicator)
The exponential moving average (EMA) adds a unique twist to the traditional moving average formula. While the simple MA treats all closing prices equally, the EMA applies more weight to the most recent data. This responsive approach allows the EMA moving average to react faster to the latest price swings, making it a good candidate for the best moving average for day trading. The exact weighting is determined by a chosen multiplier that decreases exponentially – giving the highest significance to the newest closes. For example, in a 20-period EMA, the newest close may account for 20% of the average, while the oldest has only a 0.5% impact.
This dynamic makes EMAs better suited for volatile markets where adaptability is key. Traders favor the EMA over the lagging SMA for identifying emerging trends and potential reversals earlier and combining them with other indicators for trading signals. For traders seeking a smoother, more reactive trend proxy, the EMA delivers on both counts.
How to Calculate Exponential Moving Average
The exponential moving average adds complexity through its multi-step calculation, but the payoff is responsiveness. It starts by computing a simple MA to seed the initial EMA value. Next, a weighting multiplier is derived from the chosen period count – for example, 20 periods gives a multiplier of 10%. This dictates the exponential decay in older data.
Finally, the EMA formula leverages this multiplier to give the highest weight to the newest close. It takes the current close multiplied by the multiplier and adds the previous day’s EMA multiplied by 1 minus the multiplier. This daily sequence constantly updates the EMA in favor of recent prices.
While the steps take practice, the result is an average focused on today’s action. For navigating volatile markets, the EMA’s emphasis on current conditions helps traders see emerging trends and stay ahead of swift reversals.
Exponential Moving Average Trading Formula
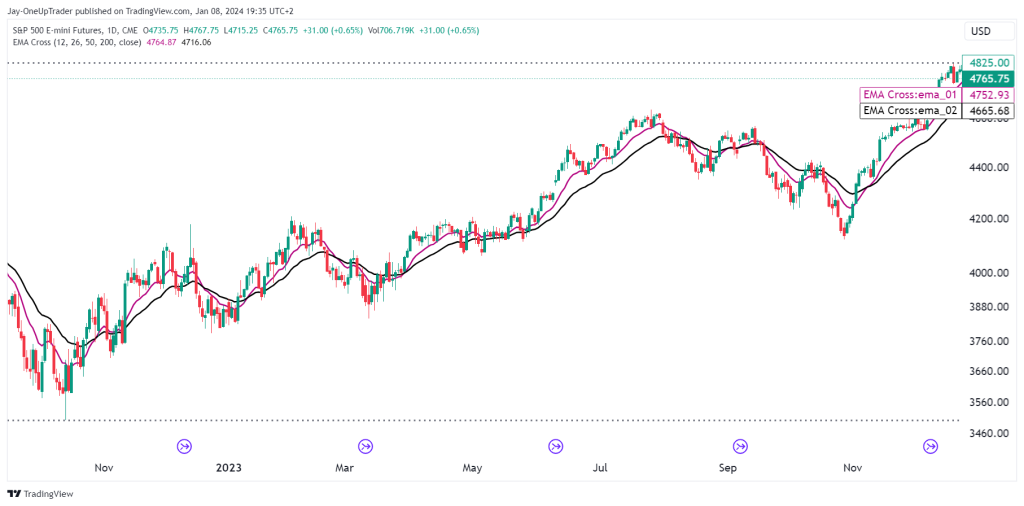
The power of the exponential moving average comes from its sensitivity to recent price swings. This makes it a well suited moving average indicator for crossover strategies. A common tactic combines a fast 12-period EMA with a slower 26-period EMA. The faster EMA reacts quickly to new moves, while the slower EMA follows the main trend. When the 12-period EMA crosses above the 26-period EMA, it signals rising momentum and a potential long entry. Conversely, a downside crossover suggests waning momentum for a possible short entry. Since the EMA prioritizes recent data, these crosses happen earlier than with sluggish SMAs. In fast markets, this early warning provides a valuable edge for traders. The EMA crossover system offers an elegant way to spot trend changes as they develop – before the competition.
Simple Moving Average VS. Exponential Moving Average
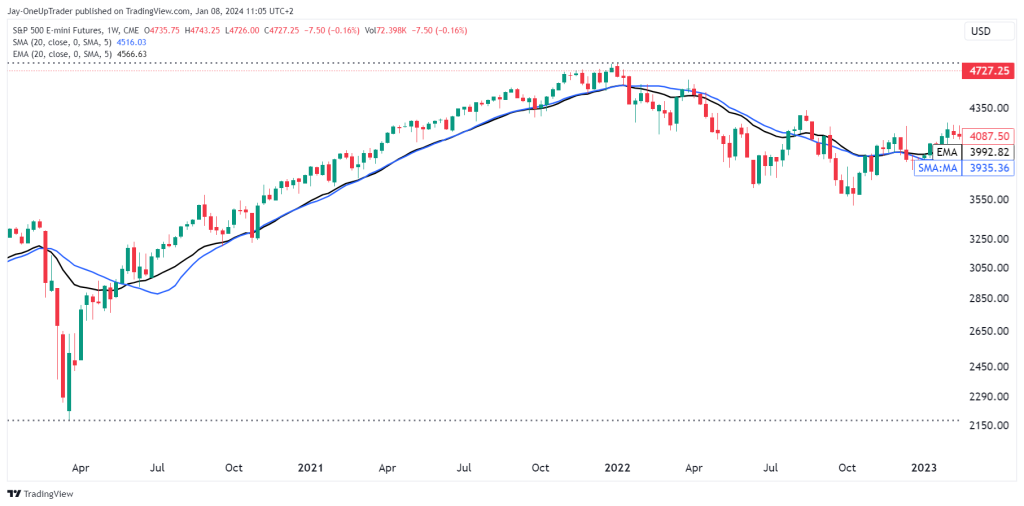
The core distinction between simple and exponential moving averages comes down to responsiveness. The SMA uniformly averages all closing prices in the lookback period. This approach smooths volatility but reacts slowly to new price shifts. Conversely, the EMA prioritizes the most recent data by exponentially decaying older prices. This dynamic weighting allows the EMA to adapt faster to changing conditions. In stable markets, the SMA’s steady approach shines. But when volatility strikes, the EMA’s sensitivity provides timelier signals to traders.
Analyzing the two side-by-side highlights their differences. When price makes a sudden turn, the steady SMA slowly responds while the agile EMA rapidly rotates to the new trend. Deciding between them depends on your strategy and market. Just remember, the trend is your friend – so use the average that tracks it best.
Weighted Moving Average (WMA Indicator)
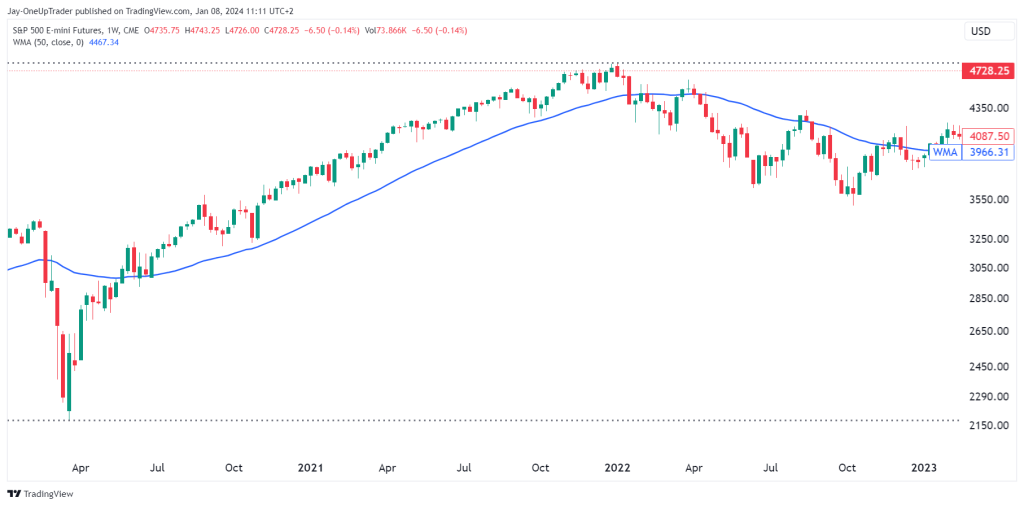
The weighted moving average (WMA) or exponential weighted moving average (EWMA) offers traders the best of both worlds by combining aspects of the simple and exponential moving averages. As its name denotes, the WMA applies weighting factors to each closing price in its calculation.
The weights steadily decrease in linear fashion over the lookback period. For example, in a 20-day WMA, the most recent closing price receives a 20% weighting, the oldest closing price gets a 1% weighting, and the days in between follow the linear slope. This gives extra importance to recent data, allowing the WMA to adapt faster to price swings. However, older prices still factor into the calculation, providing smoother trend tracking than the reactive EMA.
Traders often use the WMA as a middle ground between the ultra-smooth SMA and hyper-responsive EMA in markets with light to moderate volatility. The WMA blends just the right ratios of smoothing and sensitivity. It filters out noise more adeptly than the EMA indicator yet follows emerging shifts faster than the SMA. For an indicator equally adept at highlighting the forest and the trees, the WMA hits the sweet spot.
Moving Average Crossover Strategy
Crossover strategies remain the most popular among active traders. The approach involves overlaying two moving averages on the price chart – generally a faster and slower moving average. Common pairings include the 50-day with the 100-day or 200-day moving averages.
When the faster moving average crosses above the slower one, it signals upside momentum is building and provides a bullish entry point. This golden cross tends to precede sustained uptrends. Conversely, when the faster-moving average price crosses below the slower one, it creates a death cross indicating downside momentum and a potential short entry.
Since crossovers identify trend changes early, traders can capitalize on new movements before the herd. Moving average crossovers also provide confirmation of trend direction and help filter out false signals. For these reasons, the crossover method has stood the test of time. While simple in design, dual-moving average crossovers remain one of the most potent weapons in the trader’s arsenal.
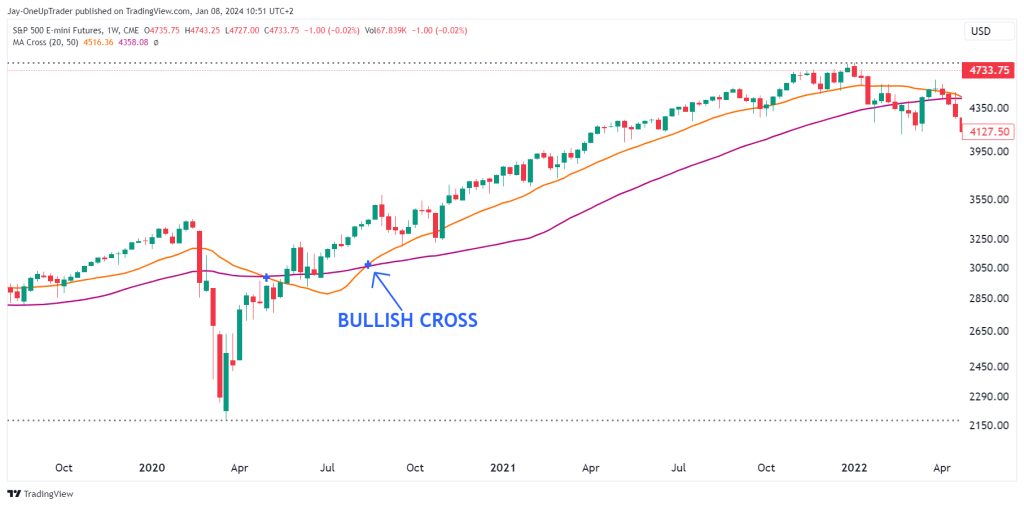
Double Moving Average Crossover Strategy
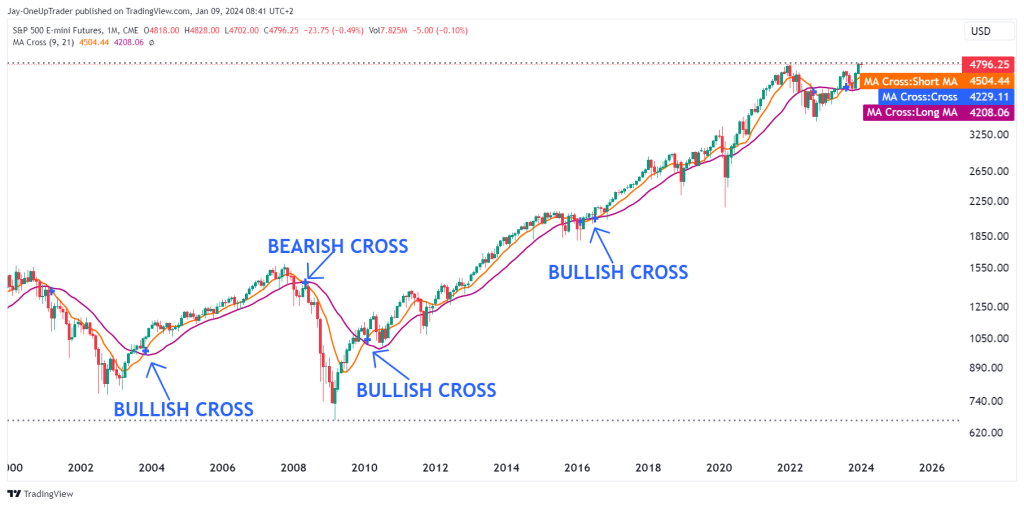
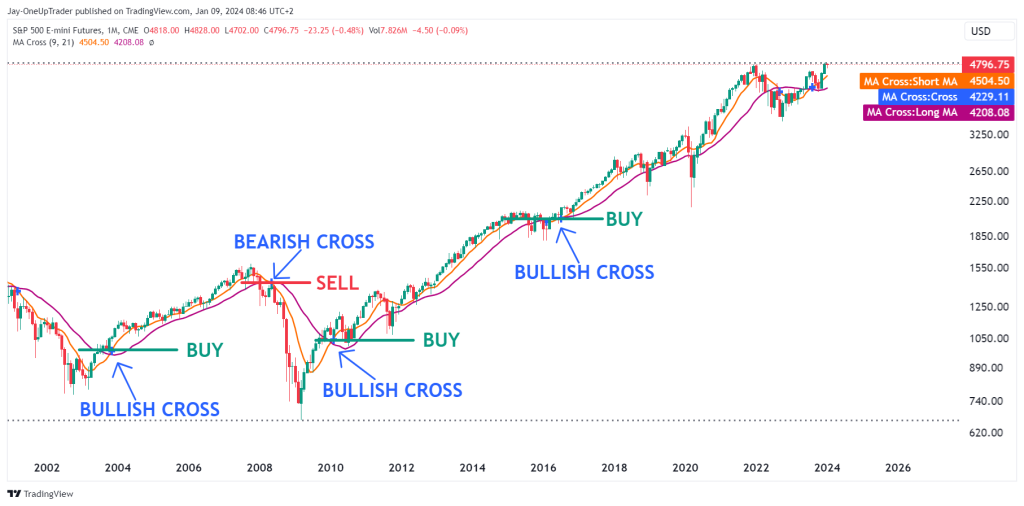
Among the most popular uses of moving averages is the double crossover method. This combines two moving averages – generally a faster and a slower moving average. The 9-day and 21-day moving averages are a common pairing. When the faster 9-day MA crosses above, the slower 21-day MA, it signals rising momentum and a potential long entry point. This bullish crossover is known as a “golden cross” and tends to precede sustained uptrends.
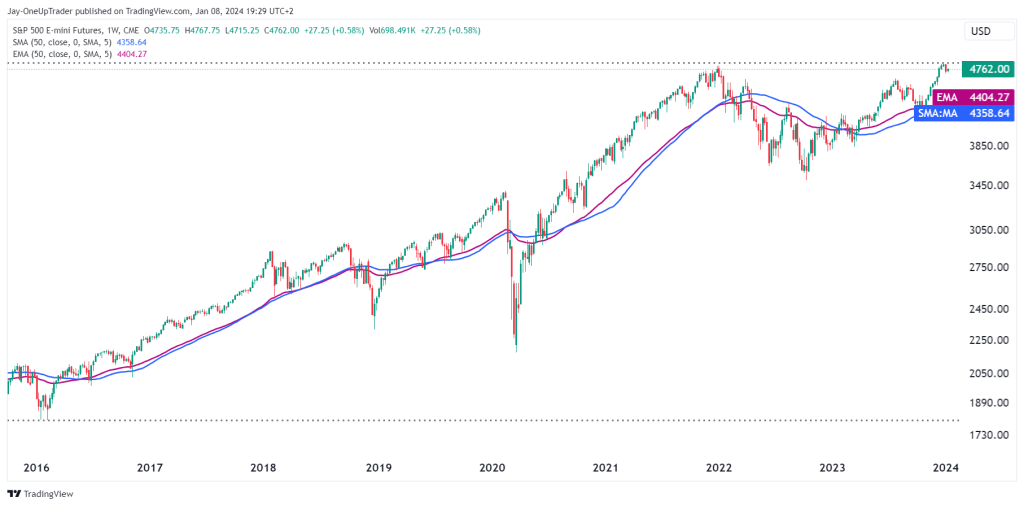
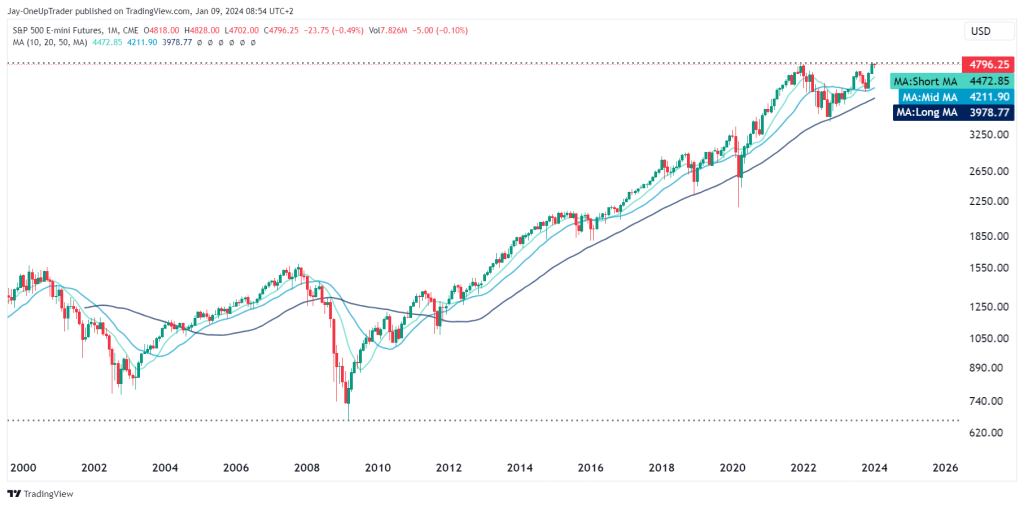
Conversely, when the 9-day MA crosses below the 21-day MA, it creates a “death cross,” which indicates downside momentum and a possible short entry. Since two moving averages are less likely to whipsaw than a single MA, the double crossover helps filter out false signals and provides higher probability trading opportunities. It also generally works better on long-term time frames, like in the chart below, which is the monthly S&P 500 chart.
Traders can further boost performance by using exponential moving averages, which react quicker to price shifts, or displaced moving averages which account for lag. The double-moving average crossover remains a straightforward yet powerful strategy.
Double Exponential Moving Average (DEMA)
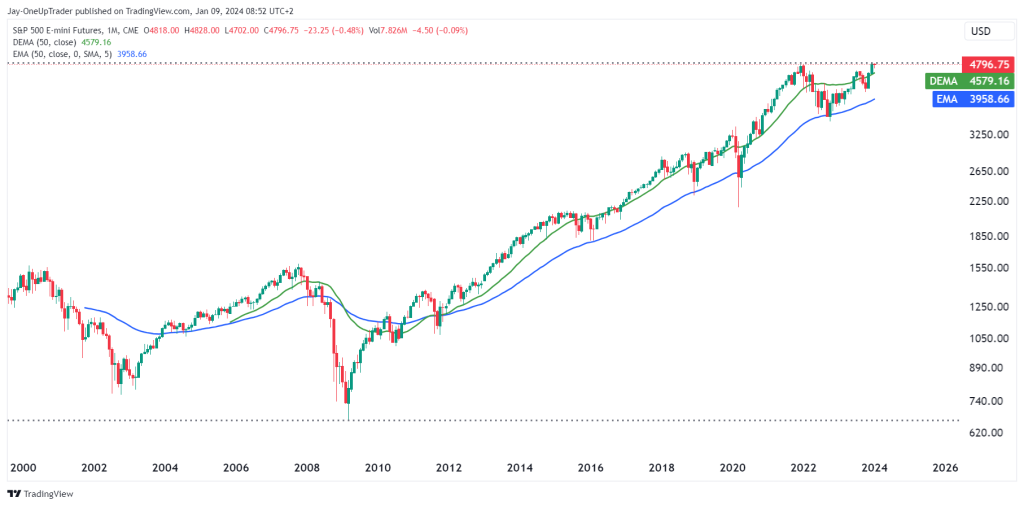
For traders seeking an even more responsive moving average, the double exponential MA (DEMA) takes sensitivity to the next level. It is a moving average indicator that builds on the EMA formula but applies additional exponential smoothing to minimize lag further.
The DEMA indicator calculates the EMA of the EMA rather than just the EMA of the price. This has the effect of giving extra weight and reactiveness to recent price moves. In volatile markets, the DEMA registers trend changes faster than regular EMAs or MAs, generating earlier trade signals. Early entry provides a valuable timing edge over other traders. However, the ultra-sensitive DEMA is prone to whipsaws during ranging or choppy markets where no clear trend exists.
Combining with oscillators like RSI or momentum indicators can improve accuracy when using the DEMA. For adaptable trend following suited to fast-moving markets, the DEMA delivers responsiveness traditional moving averages cannot match.
What is a Displaced Moving Average
As the name implies, the DMA displaces or shifts the moving average back in time by a set number of periods. For example, a 10-period DMA with a 5-period displacement would base the average on periods 5-15 rather than the most recent 10 periods. This backward shift, the opposite of moving average forecasting, which plots into the future, allows the DMA to account for lag and provide more advanced warning of potential reversals. With a regular moving average, by the time it registers a change, much of the move has already happened. The DMA’s glimpse into the past gives traders time to react. When price crosses above a displaced moving average, it signals upside momentum is building in advance. The crossover occurs earlier, creating an opportunity to get in before others spot it.
For traders frustrated by late signals, the displaced moving average provides the perfect solution – an accurate trend indicator for the future. While time travel remains elusive, the DMA lets traders peek just enough into the past to stay ahead.
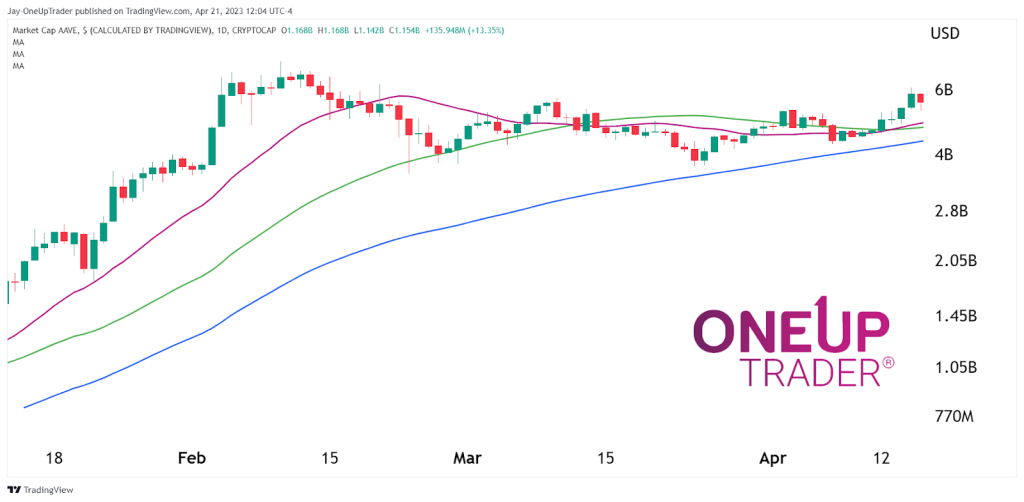
Triple Moving Average Indicator
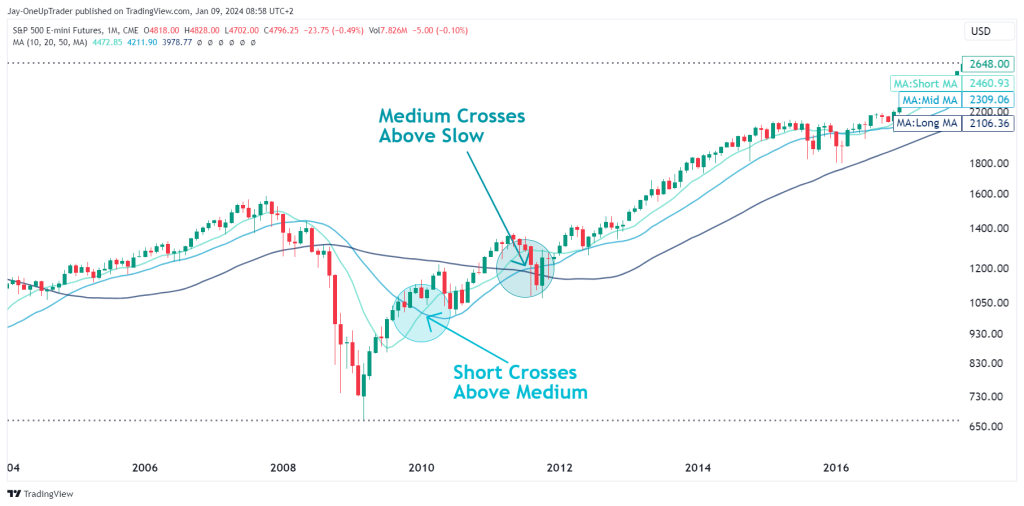
The triple moving average crossover further amplifies trading signals. This uses three moving averages – a fast, medium, and slow MA, such as 10-day, 20-day, and 50-day. The system looks for alignments between the three MAs. The fastest MA crossing above the medium MA signals short-term momentum. However, the signal only confirms once the medium MA crosses the slowest MA. This provides greater accuracy in identifying new uptrends early. Multiple MA crossovers help filter out false signals and reduce whipsaws.
The downside triple crossover works the same way in reverse to identify emerging downtrends. The triple crossover system combines the power of three moving averages to spot high-probability trend changes as they develop.
Triple Moving Average Crossover Strategy
The triple moving average crossover further amplifies trading signals. This uses three moving averages – a fast, medium, and slow MA, such as 10-day, 20-day, and 50-day. The system looks for alignments between the three MAs. The fastest MA crossing above the medium MA signals short-term momentum. However, the signal only confirms once the medium MA crosses the slowest MA. This provides greater accuracy in identifying new uptrends early.
Multiple MA crossovers help filter out false signals and reduce whipsaws. The downside triple crossover works the same way in reverse to identify emerging downtrends. The triple crossover system combines the power of three moving averages to spot high-probability trend changes as they develop.
Triple Exponential Moving Average (TEMA Indicator)
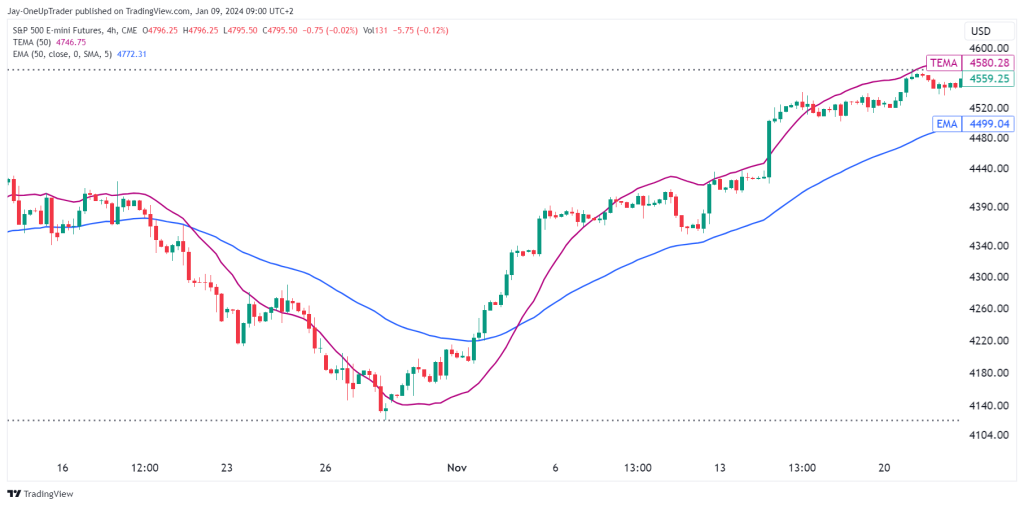
For the ultimate in reactive trend following, the triple exponential moving average (TEMA) takes moving average sensitivity to another level. This moving average indicator calculates a single EMA, then takes the EMA of that EMA, and finally computes the EMA of that result. This triple smoothing process focuses aggressively on the most recent price action.
The TEMA responds faster than standard EMAs and DEMAs, almost eliminating lag altogether. This provides the earliest possible trend change warnings to traders. However, false signals also increase for TEMAs during choppy or ranging markets. Combining with oscillators can improve accuracy. In strongly trending markets, the TEMA delivers unmatched responsiveness and early signal advantage. The cost is whipsawing, so prudent risk management remains essential.
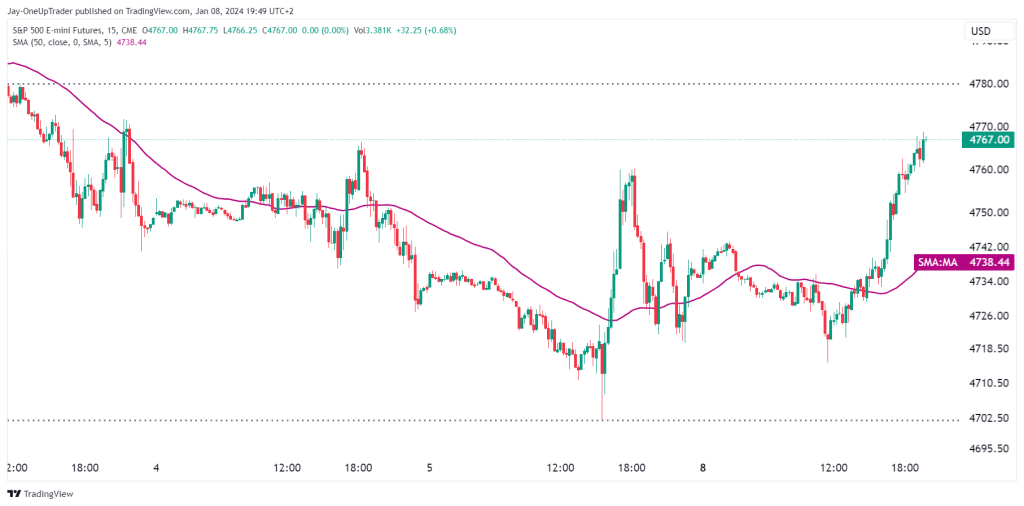
Best Moving Average For Day Trading
When day trading, moving averages provide indispensable trend context on short timeframes. The best-moving average depends on your strategy, market, and time horizon. For hyper-short-term swings, the 10-day MA tracks near-term momentum. Conversely, the 50-day MA identifies larger trends.
In between, the 20-day MA balances responsiveness and smoothing. For adaptability, exponential moving averages (EMAs) outperform simple moving averages (SMAs) due to their greater sensitivity to recent prices. However, no one moving average works perfectly alone.
Combining various EMAs and SMAs provides more robust signals. A 10 and 20-day EMA crossover system confirms new intraday swings faster. Adding a 50-day SMA filters out false signals. Blending MAs with leading indicators like MACD and RSI provides the most timely and highest probability setups.
The right mix of MAs, EMAs, and other technicals creates an invaluable trading toolbox for day traders. Remember, none of this matters if strict risk management rules and a solid trading plan are in place. You can read our guide on risk management here.
Conclusion
Moving averages are indispensable indicators for traders of all skill levels. Whether using the straightforward SMA, responsive EMA, or balanced WMA, these tools provide invaluable insights into trend, momentum, support/resistance, and potential reversal points.
By visualizing the dynamic average price over a defined lookback period, moving averages smooth out volatility to illuminate the underlying trend. Crossovers with price and other moving averages then generate potent trading signals to capitalize on.
Traders can further boost performance by combining moving averages with leading indicators like MACD and RSI or even the tema indicator for greater precision. No single indicator provides the full picture – effective trading systems blend multiple techniques.
Yet even armed with an arsenal of moving average strategies, the importance of risk management cannot be overstated. Without prudent position sizing and stop losses, even the best setups can lead to ruin. Moving averages offer clarity amidst the fog – but only through strict risk controls can traders smoothly navigate the markets. Use these robust indicators to gain an edge, but keep one eye on risk and the other on reward.


