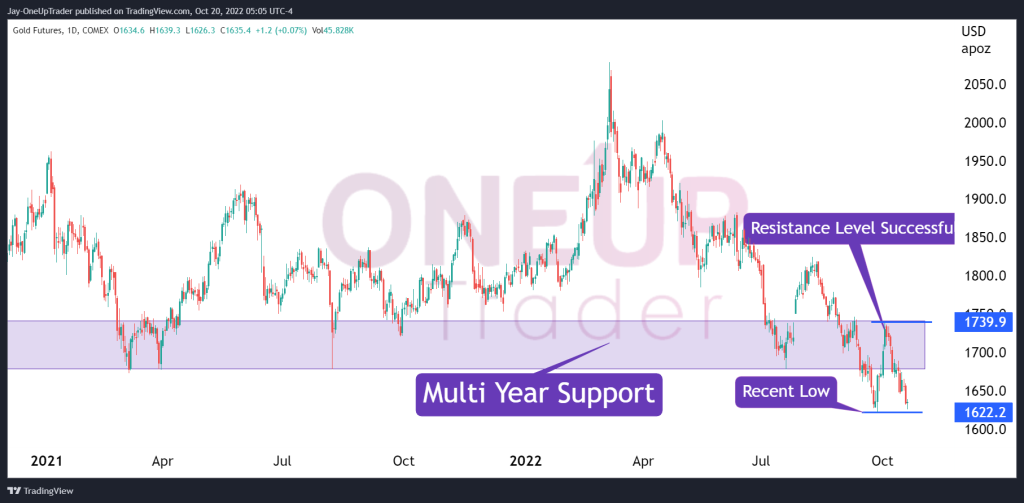
- Multi-Year support level successfully holds as resistance.
- Is Gold oversold in the short term?
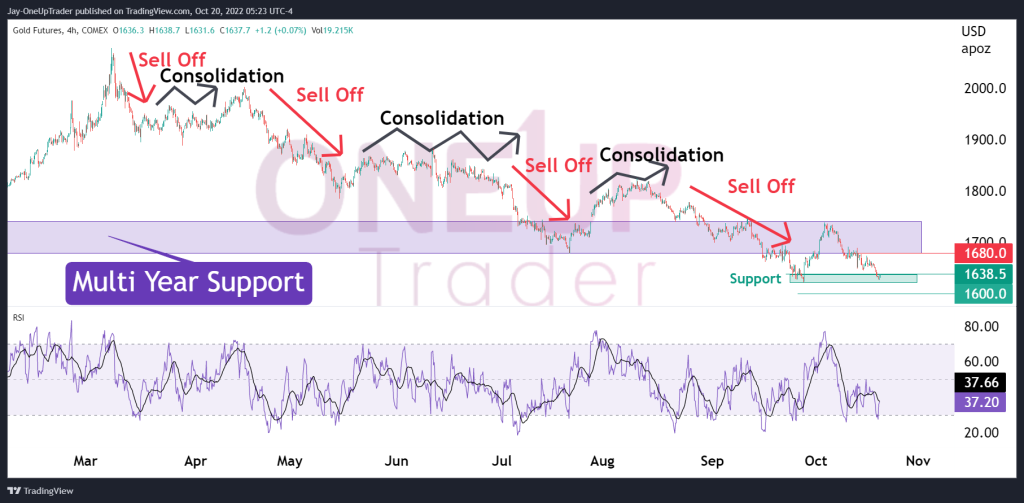
- Sell-off followed by consolidation pattern on the 4-hourly chart.
Multi-Year Support Now Resistance
If we rewind to last month, we watched gold break below the major support after holding for over two years. We stated that the level could turn into resistance, and we see now that it has played out accordingly. The article can be found here.
As Gold reached $1,622.2, it found a footing around those levels and rallied into the key level to make a short-term high of $1,739.9. It was a good level to begin looking for shorts, and traders who took advantage of that setup are well in the profit now. The question going forward is if Gold could be oversold in the short term and if we see a slight bounce occurring before we break below the recent low of $1,622.2.
Is Gold oversold in the short term?
The RSI has just bounced out of the oversold level of 30 on the 4-hourly chart; this does not mean Gold can’t fall much further from here. Looking at the technical support level between $1,622.2 and $1,638.5, we see a greater probability of a short-term bounce within the overall downtrend at this stage. The good thing about this forecast is that our risk is defined below the $1,622.2 low, so if prices fall below that level, we’ll know the trade idea is wrong and can let the stop take us out.
The sell-off recently has been followed by a period of consolidation which means we could see the Gold price bounce within the minor support at $1,622.2 up to $1,680 or higher before we head back down to test the lows again. We can monitor the RSI to watch for overbought, and once we see that, it could be a signal to look for shorts. This trade has potential because if the price drops below the previous lows of $1,622.2, we could see the price fall much further with targets of $1,600 in the near term.