- A recap of last week’s analysis.
- Multi-year support broken to the downside after 2 years
- A look into the Fibonacci Fan Analysis
Last Week’s Recap
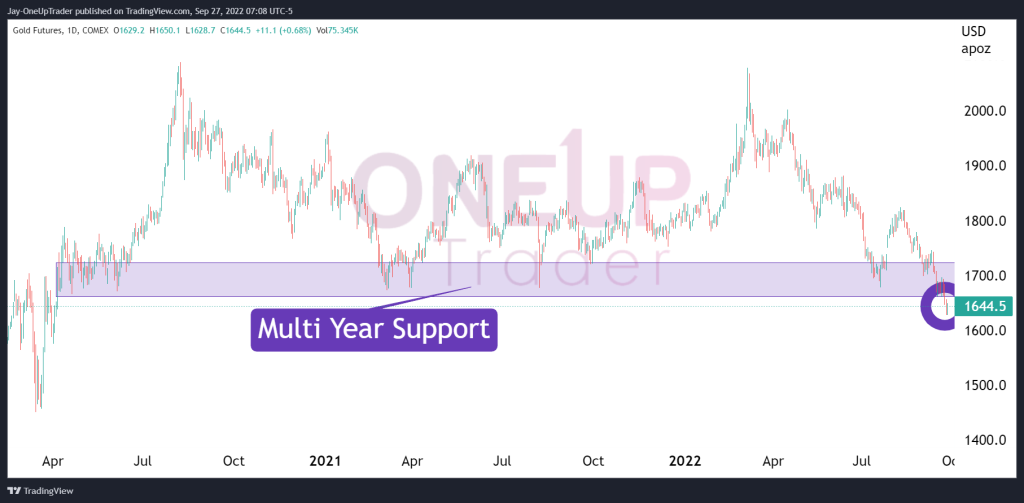
Two potential scenarios were given for GC in our analysis from last week. Scenario two has played out with the gold price finally breaking below the multi-year support, which has held firmly since April 2020. We noted that prices could try to find a footing below $1,660, and we currently see it trading at $1,646.80. We also mentioned the pennant that was forming too, and when it broke to the downside, the price fall accelerated.
Multi-Year Support Might Act As Resistance
It’s a well-known theory that support, when broken, often turns into resistance. When we see a strong bearish break like we have here, the market will likely attempt to re-test the area in the opposite direction as resistance.
Fibonacci Fan Analysis
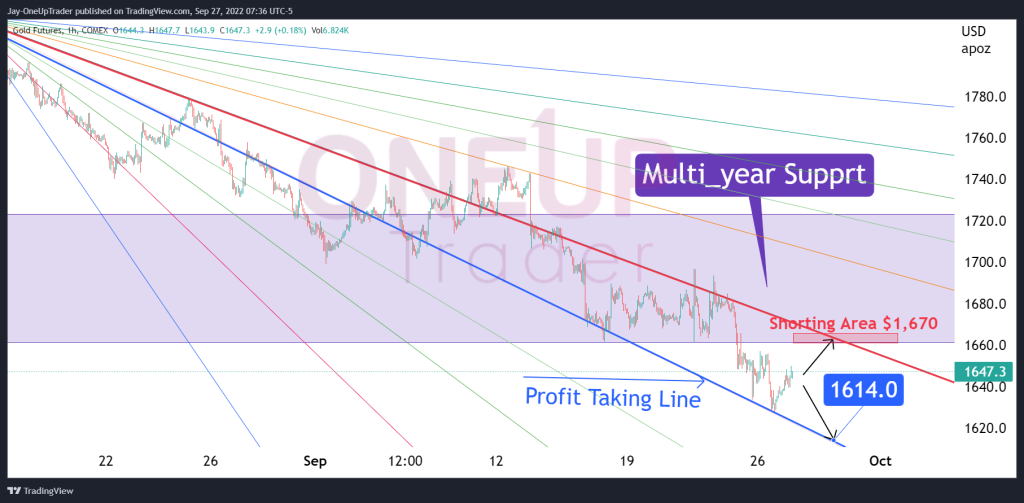
The Fibonacci fan gives an excellent structure to the gold chart on the hourly time frame. The highlighted blue line has acted as support and has proven to be a reliable target for any short trades. The highlighted red line has acted as a strong resistance to sell into.
Bull Trade Using Fibonacci Fan
The bullish trade is one we feel is the riskier play because it may be slightly late. Ideally, we would have liked to initiate longs at around $1,630 when prices test the blue line highlighted below. Targets for the long trade will be at the red resistance line, which is the 0% Fibonacci level. That line also falls within the multi-year resistance, so we can predict there would be a fair amount of selling pressure around $1,670.
Bear Trade Using Fibonacci Fan
Since the gold price has been in a downtrend for a while, the short trade right now goes with the trend, which is always an added benefit. Shorts could be looking at taking profits at the blue Fibonacci line we mentioned above as soon as the price touches it (around $1,614).