

- The parabolic curve on CL’s daily chart remains a strong formation, with the price sitting at $70 per barrel and showing resistance above $66.
- If recent patterns repeat, bullish price action could emerge, potentially pushing the price up to $81 in the coming weeks.
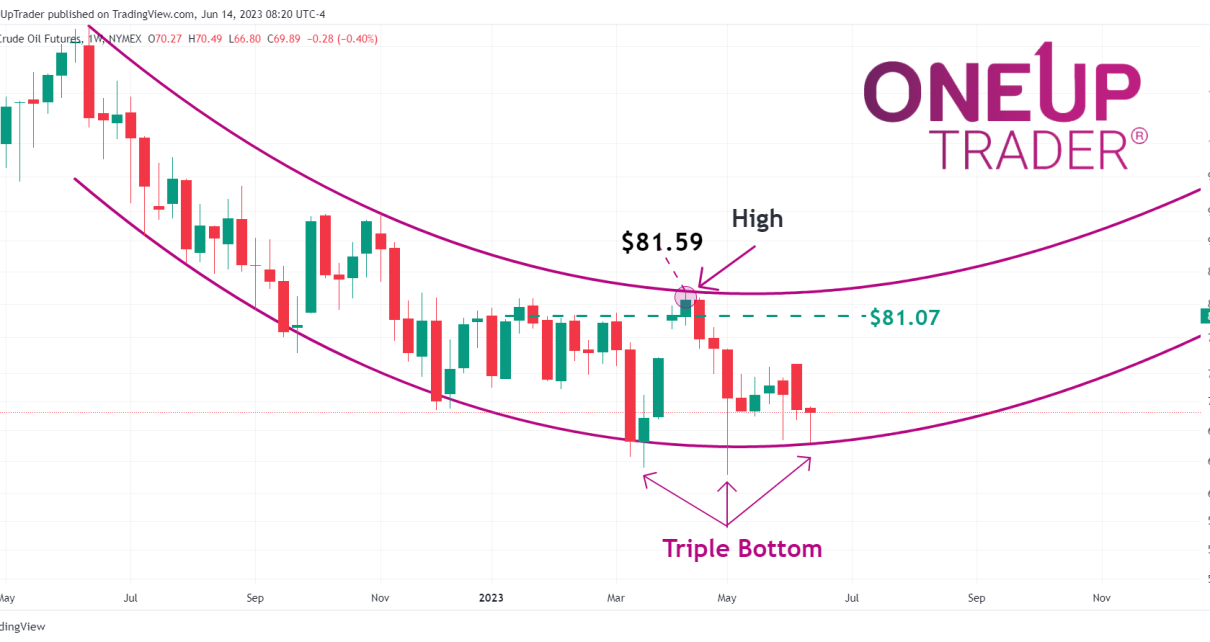
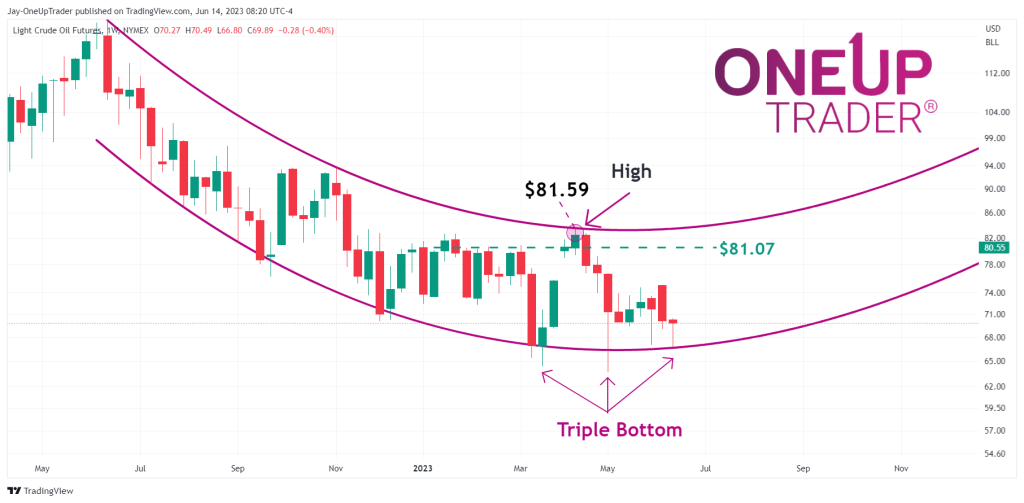
- Technical factors include a triple bottom formation on the weekly chart and solid support forming at current prices, indicating a potential accumulation opportunity for bulls. Additionally, a break above $83 could signal a long-term move toward $110 by the end of 2023.
Parabolic curve
The parabolic curve on the daily chart for CL has been our main focus point for most of the crude oil analysis this year. It stretches back to July of last year and still remains a strong formation. Price is currently sitting at $70 per barrel, and bears are still unable to push it below $66.
If the recent patterns repeat themselves, with CL bouncing between $66 and $81, then we can suspect some bullish price action to creep into Oil. Bulls could push the price up to $81 within a few short weeks.
Technical factors to keep in mind
There is a triple bottom forming on the weekly chart. Another bullish indicator was added to the analysis we did on the daily chart. Bulls can begin accumulating now since there is a solid amount of support forming at current prices.
CL breaking above $83 would likely lead to a move much higher, around $110. This is a long-term view and might only come into play toward the end of 2023.