


Facebook (FB US) equity price showed a rise of 6.5 percent against the consensus figure for the Q2 market income expectation results. The report released showed a Q2 20-revenue increase of 18.7bn US dollars which amounts to an additional 11 percent year by year growth. The recorded figure grew higher than the projected consensus income of 17.6bn US dollars and GAAP EPS of 1.80 US dollars equivalent to more than 98% year by year growth.
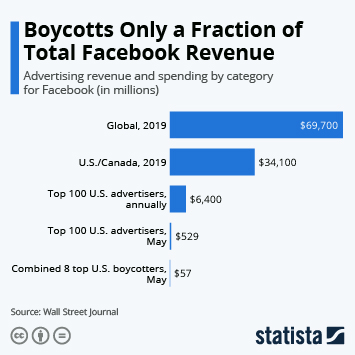
The recorded figure was FACE 25% above the 1.44 consensus figure. Irrespective of the recent content linked embargoes and supervisory inspection, Facebook continues to record high ad revenue growth for the first three weeks of July. The ad revenue rose by 10% year/year figure compared to the earlier projected consensus figure of 7% rise. Going forward, the company’s management anticipates that the revenue growth in a quarter will tread a similar route and equally make a 10% year/year rise.
We anticipate that Facebook (FB US) will continue to maintain its position as one of the best performing stock in the Equity market. Yes, we believe that the diversification efforts of Facebook which includes monetizing WhatsApp and engaging in online sale enterprises will boost the company’s medium-term growth, irrespective of the short-term burden it faces due to the content-linked related embargoes and stricter regulatory watch.
Some Significant Points To Note About Facebook Q2 ResultsGAAP net gain showed a 98% year/year rise up to 1.58bn US dollars
Q2 year/year income grew by 11% to 18.7 bn US dollars, with ad revenue growth of 14% year/year in North America, and in the European Union, the revenue growth is 9%, whereas the remaining revenues showed an impressive 40% rise.
Facebook also recorded an increase in the number of global Monthly Active Users (MAUs) by 12% year/year and made a mark of 2.70bn against the consensus projection of 2.63bn. It also recorded a 12% year/year growth of Global Daily Active Users (DAUs) and made a mark of 1.79 bn. However, the ratio of the DAU to MAU ratio fell a bit from 67% to 66% compared to the figure of the first quarter.
Besides average revenue per user (ARPU) globally went a bit higher from the year/year consensus figure of 6.76 to the 7.05 US dollars.
GAAP operational revenue showed a rise of 29% year/year and reached 5.96bn US dollars due to a reduction in general and administrative expenditure which resulted in a year/year rise of the operating margin up to 32%. GAAP net gain showed a 98% year/year rise up to 1.58bn US dollars.
Q2 year/year income grew by 11% to 18.7bn US dollars, with ad revenue growth of 14% year/year in North America, and in the European Union, the revenue growth is 9%, whereas the remaining revenues showed an impressive 40% rise.
Facebook also recorded an increase in the number of global Monthly Active Users (MAUs) by 12% year/year and made a mark of 2.70bn against the consensus projection of 2.63bn. It also recorded a 12% year/year growth of Global Daily Active Users (DAUs) and made a mark of 1.79 bn. However, the ratio of the DAU to MAU ratio fell a bit from 67% to 66% compared to the figure of the first quarter.
Besides average revenue per user (ARPU) globally went a bit higher from the year/year consensus figure of 6.76 to the 7.05 US dollars.
GAAP operational revenue showed a rise of 29% year/year and reached 5.96bn US dollars due to a reduction in general and administrative expenditure which resulted in a year/year rise of the operating margin up to 32%. GAAP net gain showed a 98% year/year rise up to 1.58bn US dollars
Overview of Facebook’s Management Direction
Ad revenue growth for the first three weeks of July corresponds with that of Q2 and is above 10% year/year yield. However, it is more than the projected consensus figure estimated to be more than 7%. The company’s management expects Q3 ad revenue will show related growth of (c.10% year/year) figure.
Facebook equally released an entire year expenditure estimate to be in the range of 52 to 55 bn US dollars against the earlier outlook of 52-56 bn US dollars range. Also, the entire-year capital expenditure which was formerly placed at a16 bn range showed an increased rate compared to the earlier projected 14 to16 bn US dollars range.
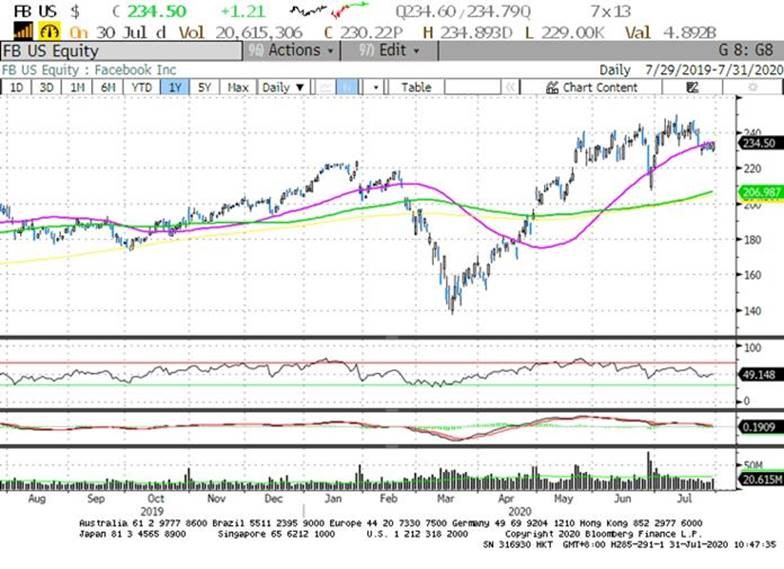
JB RSCH purchase rating on Facebook (FB US) targets 240.00 US dollars as its price.
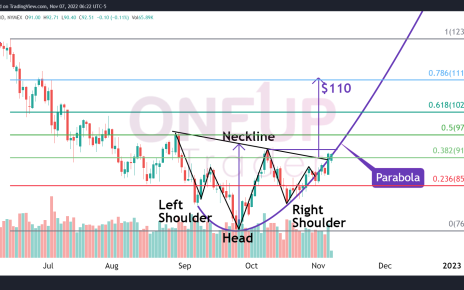
Technical Analysis Chart
After the more than 6.5 % post-market rally, the US Facebook equity trades above the set 50D average.
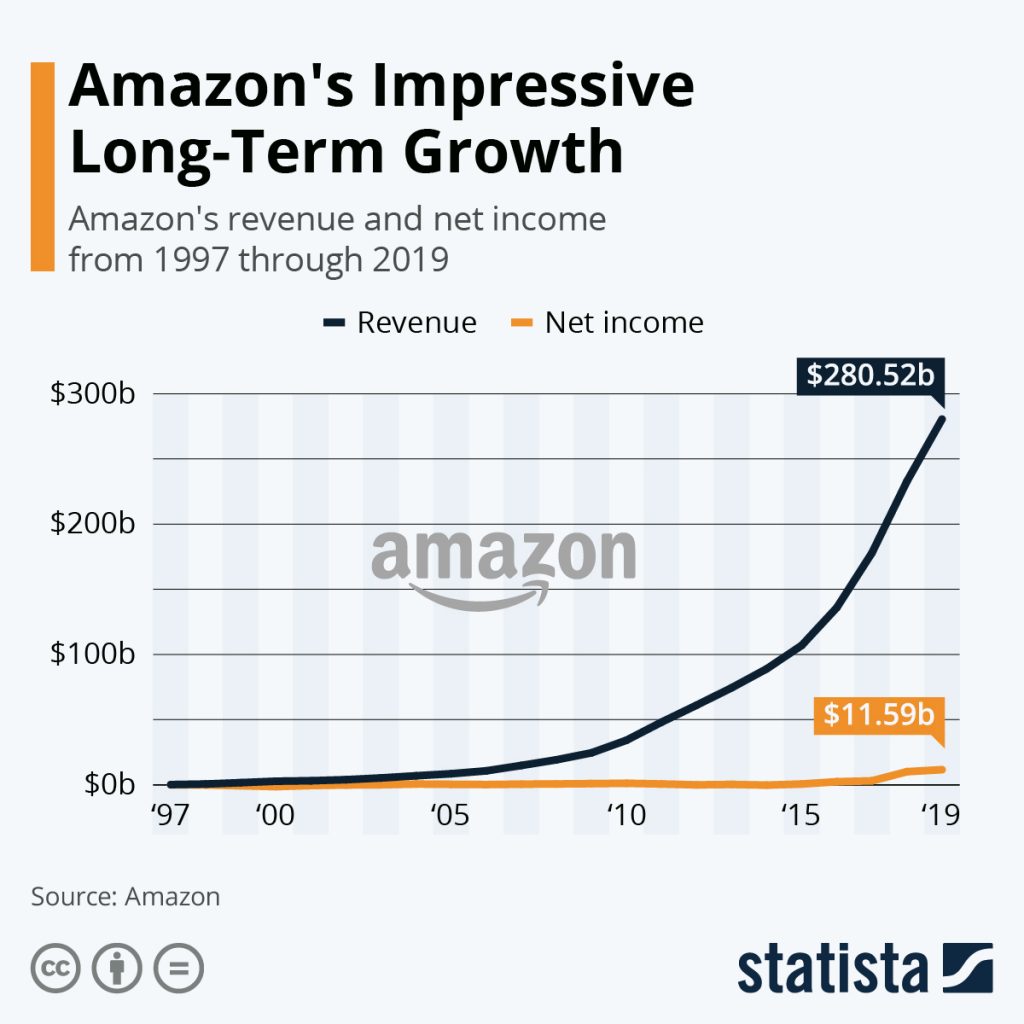
Amazon (Amzn Us): Q2 Income Growth Rises More Than The Consensus Figure, Thanks To The Guidance That Shows Vigorous Outlook

Amazon (AMZN US) showed revenue growth of 5%, thanks to post-market second-quarter results and vigorous outlook guidance. The company recorded a 40% year/year revenue growth to USD 88.9bn. It beat consensus with 10%.
Also, the operating earnings showed growth of 5.8bn US dollars, making an increase of more than 89.5% year/year growth and breached the consensus figure of 964mn US dollars. The recorded figure equally grew higher than the highest range of Facebook’s guidance of -USD1.5bn to USD1.5bn range. The company’s positive Q3 projection implies that vigorous e-commerce tailwinds will extend into 2H.
These highlights and growth prospects continue to place Amazon stock among the best-performing picks in the Equity market. We anticipate that Amazon will continue to be a leader in the industry in the face of the present crisis that has resulted in increased e-commerce migration.
Besides, Amazon has demonstrated robust implementation potential. Considering post short-term e-commerce, migration due to the present COVID-19 pandemic, we anticipate that Amazon US will continue to soar high in the long-term, given the structural trends like online sales, cloud computing, digital advertising, and AIs.
Significant Points To Note About Amazon Q2 Revenue Growth Rate Outcome
- The company’s online store’s income increased by 47.8% year/year to 45.9bn US dollars. This is against Wall Street’s projected figure of 15%. Also, the third-party seller revenue rose by 52.1% to the 18.2 bn marks, thanks to the solid paid unit growth of (58% against the 27% consensus).
- Physical store income was 3.8 bn dollars and this was a 12.8% year/year fall against the 17% figure projected by the Street.
- The revenue made through subscription services showed an increase of 28.7% and made a 6.0 bn US dollars mark.
- The company’s AWS or its cloud computing infrastructure revenue grow by 29% year/year and made a mark of10.8bn US dollars. This was a fall from 33% growth recorded in the first quarter. It equally missed the projected consensus figure of 1.7%. Nonetheless, a 65% year/year increase in accumulation shows a promise of long-term growth.
- The company’s operating income showed a robust increase of 89.5% to 5.8bn US dollars with operating margin growing to 6.6% (against the 4.9% in Q2 of 2019 and 5.3% in Q1 2020), thanks to the operating leverage and restraint in marketing expenditure, irrespective of the >4bn US dollars COVID-associated expenditures.
- The Net revenue of the company increased by 99.7% to 5.2bn US dollars.
The Amazon Management Guidance Outlook
Amazon management projects that the company’s Q3 2020 revenues would be between the range of 87.0bn US dollars to 93.0bn US dollars and that is greatly above the projected consensus figure of 86.3bn US dollars. Q3 2020 EBIT is anticipated to be around the 2.0 bn range of 5.0bn US dollars against the projected consensus figure of 3.0 bn US dollars.
The company’s management is optimistic about top quality member engagement, which has resulted in additional recurrent shopping with advanced baskets. The renewal rates and online grocery sales also increased, with delivery order volume increasing by 160%.
JB RSCH Hold rating on the Amazon stock shows a price target of 2000.00 dollars for the stock.
Technical Chart
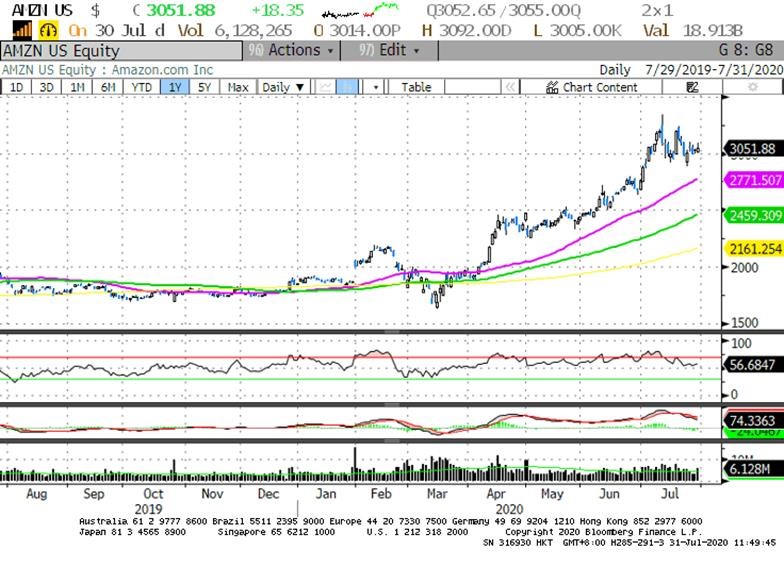
The stock showed a 5% post-market increase and continues to trade beyond the 50D moving average.